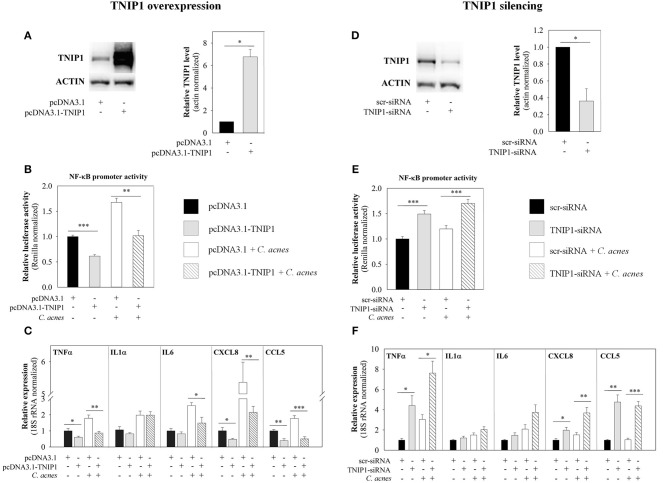
Figure 2.
Effects of TNIP1 levels on the downstream targets of the TLR signaling pathway. After plating HPV-KER cells, TNIP1 overexpression (24 h) (left panel) or siRNA-mediated silencing (48 h) (right panel) was performed. Subsequently, cells were treated with C. acnes (MOI = 100) for 6 h. (A,D) TNIP1 protein levels were analyzed by western blot after overexpression or silencing and quantitated using Image Pro Plus, where all data were normalized to actin; a representative blot is shown. Error bars are SD. (B,E) NF-κB promoter activities were measured with a luciferase reporter assay; data were normalized to signal from a vector constitutively expressing Renilla luciferase and compared to time-matched samples transfected with vectors that were empty (pcDNA3.1) or contained scr-siRNA. (C,F) mRNA levels of TNFα, IL-6, CXCL8 and CCL5 were analyzed by real-time RT-PCR; data were normalized to 18S rRNA using the ΔΔCt method and compared to time-matched samples transfected with vectors that were empty (pcDNA3.1) or contained scr-siRNA. Error bars are SEM. Statistical analyzes: paired, two-sample t-test: *p < 0.05, **p < 0.01, ***p < 0.001.

