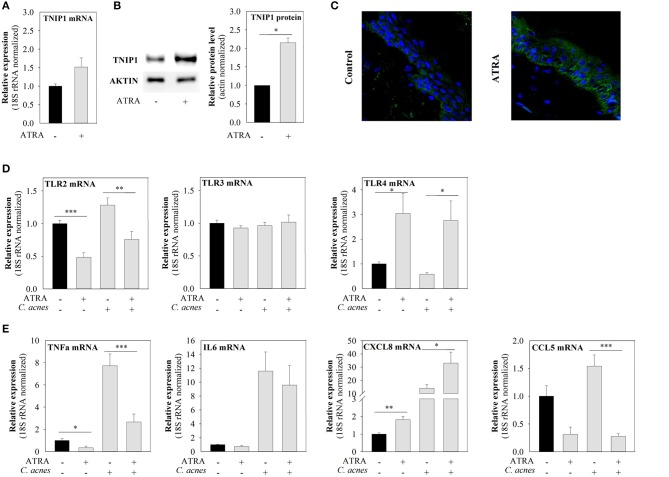
Figure 4.
ATRA induces TNIP1 expression and affects the expression of TLRs and downstream targets of the TLR signaling pathways. HPV-KER cells (A,B) were treated with 10−6 M ATRA for 48 h or ex vivo skin (C) with 1.5 × 10⁻⁶ M for 24 h, and TNIP1 mRNA and protein levels were analyzed. (D,E) HPV-KER cells were treated with 10−6 M ATRA for 48 h and challenged with C. acnes (MOI = 100) for 6 h. mRNA expression of TLRs and selected pro-inflammatory molecules was analyzed. mRNA expression changes were detected by real-time RT-PCR; data were normalized to the 18S rRNA using the ΔΔCt method and compared to the untreated control values. Error bars are SEM. (B) TNIP1 protein was detected by western blot analysis and quantitated using an Image Pro Plus; a representative blot is shown, or (C) was visualized with immunofluorescence staining for TNIP1 (green) and DAPI (blue). Statistical analyzes: paired, two-sample t-test: *p < 0.05, **p < 0.01, ***p < 0.001.

