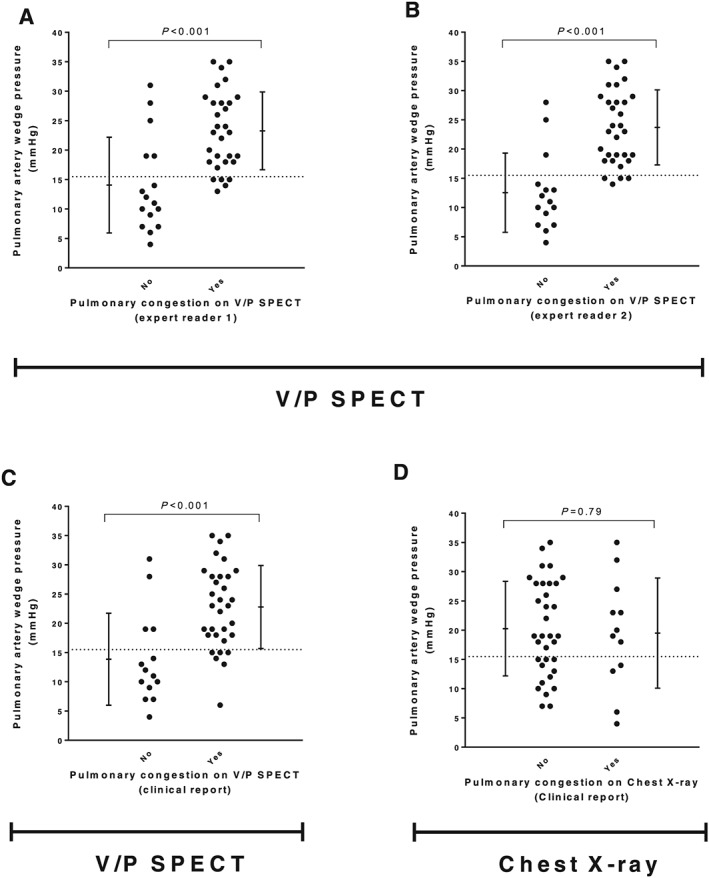
Figure 3.

The upper panels (A and B) show how signs of pulmonary congestion on V/P SPECT images, assessed by expert readers (blinded to the perfusion gradients), compared with pulmonary artery wedge pressures. The two bottom panels (C and D) show the same comparison for V/P SPECT and chest X‐ray images assessed by physicians in the clinical routine. The dashed line represents the chosen threshold value for pulmonary congestion (pulmonary artery wedge pressure > 15 mmHg). The error bars show mean ± 1 SD.
