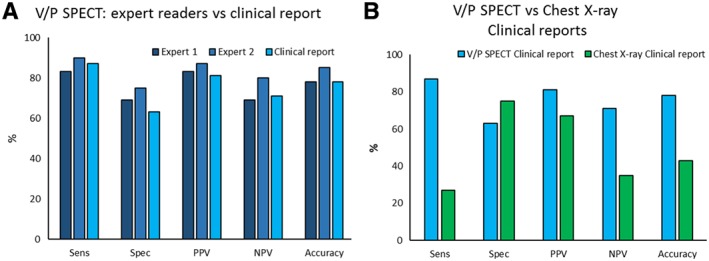
Figure 4.

The diagnostic performance of visual assessment of ventilation/perfusion single‐photon emission computed tomography (V/P SPECT) and chest X‐ray for diagnosing pulmonary congestion, using pulmonary artery wedge pressure > 15 mmHg as threshold value. (A) The bars in the two darker blue colours show the performance of V/P SPECT assessed by the expert readers, and the light blue bars show V/P SPECT assessed by physicians in the clinical routine. (B) The light blue bars are identical to the ones in panel A and shows V/P SPECT when assessed in the clinical routine, now compared with chest X‐ray (green bars) assessed by radiology specialists in the clinical routine. Sensitivity (Sens), specificity (Spec), positive predictive value (PPV), negative predicted value (NPV), and accuracy.
