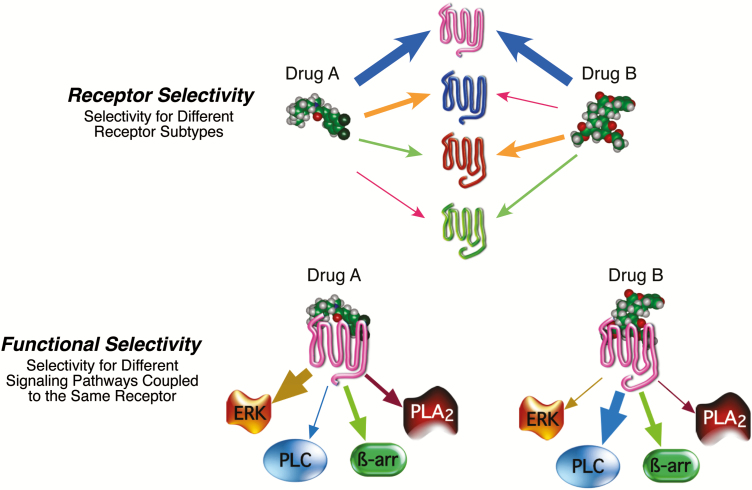
Figure 4.
Drug selectivity. (Top) Receptor selectivity is based on differential affinity for different receptor subtypes. Affinity of drugs A and B is reflected by the thickness of the arrows. As shown, drugs A and B have high affinity for the magenta colored receptor and low affinity for the green colored receptor. (Bottom) Functional selectivity is based on differential efficacy of a drug to regulate the activity of various signaling pathways coupled to a single receptor subtype. Signaling selectivity is illustrated as thickness of the arrows between the drug-activated receptor and the cellular signaling pathway. As shown, the selectivity profile for drug A is ERK>ß-arrestin>PLA2>PLC, whereas that for drug B is PLC>ß-arrestin>PLA2>ERK. If PLC signaling led to a therapeutic benefit and/or ERK signaling led to an adverse effect, drug B would be the preferred drug. Abbreviations: ß-arr, ß-arrestin; ERK, extracellular signal-regulated kinase; PLA2, phospholipase A2; PLC, phospholipase C.

