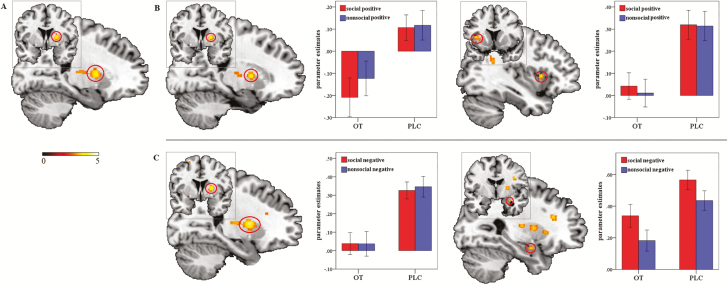
Figure 2.
(A) Decreased right striatum activity in the oxytocin (OT) compared with the placebo (PLC) group. (B) Decreased activity in the right striatum and the left dorsal anterior insula (AI) in the OT compared with the PLC group during appetitive approach. (C) Decreased activity in the right striatum and the right amygdala in the OT compared with the PLC group during aversive avoidance. Statistic maps were displayed with a P<.005 uncorrected threshold. Error bars show standard errors.

