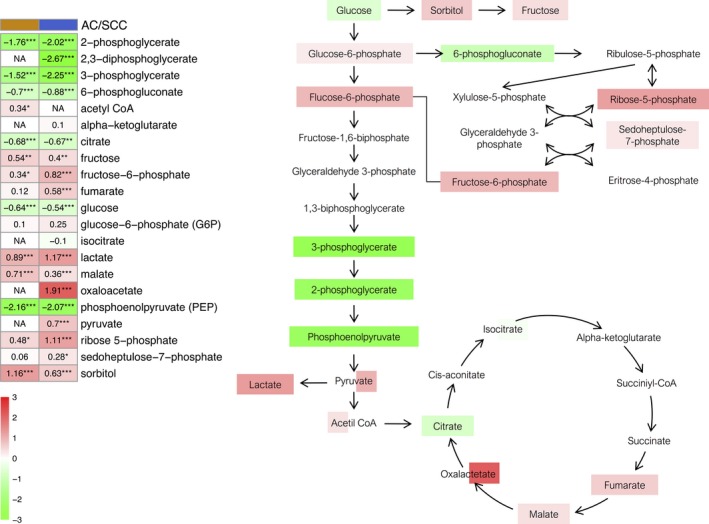
Figure 2.

Glucose metabolism pathway. The heatmap shows the mean of the log‐transformed tumor/normal ratios for metabolites in AC (orange) and squamous cell cancer (blue). Increase (red) or decrease (green) in metabolite level. *P < 0.05, **P < 0.01 and ***P < 0.001.
