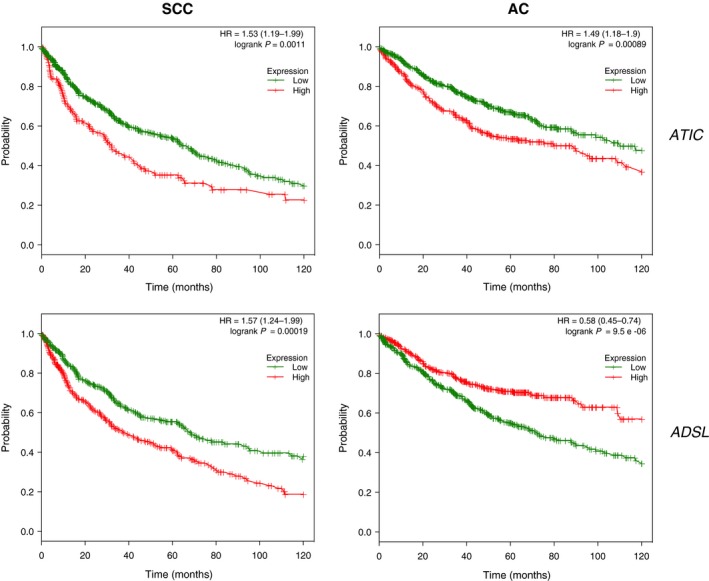
Figure 8.

Association between ADSL/ATIC genetic expression and survival in LC cohorts. Kaplan–Meier plots for ADSL and ATIC genetic expression (high and low levels) in LC cohorts available from kmplotter (n = 724 for AC and n = 524 for SCC). Log‐rank P‐values and hazard ratios (HR; 95% confidence interval in parentheses) are shown. The P‐value represents the equality of survival curves based on a log‐rank test.
