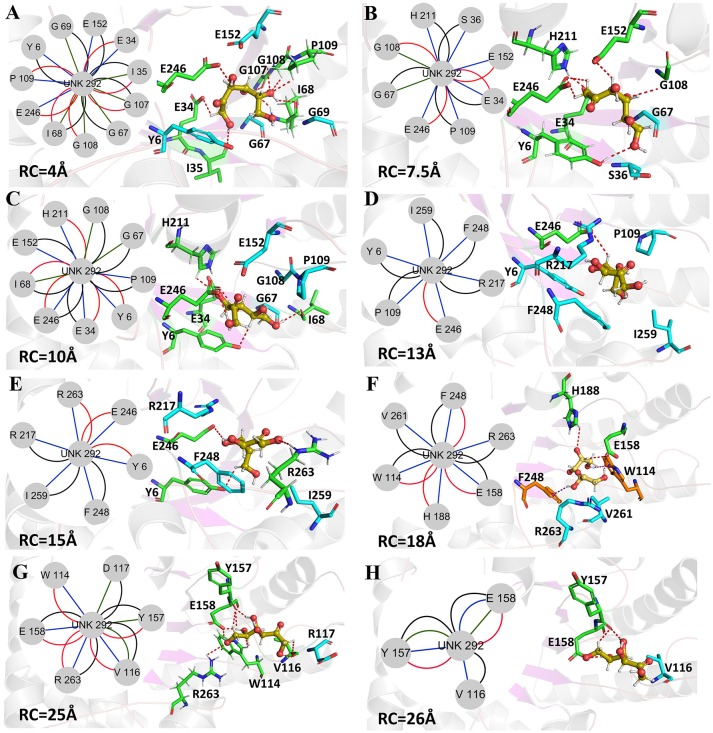
Figure 10.
Representative structures in the dissociation process of the D-fructose from the Y68I/G109P mutant during ASMD simulations. The detailed location of (A–H), along the dissociation process at 4, 7.5, 10, 13, 15, 18, 25, and 26Å, respectively. The residues forming hydrogen bonds (red dashed line) in ligand dissociation are highlighted in green. The residues forming Donor-π interactions (purple dashed line) in ligand dissociation are highlighted in orange. The residues participating in the other interactions are highlighted in cyan. The D-fructose is highlighted in yellow. Subnetwork analyses of the D-fructose are displayed as two-dimensional view. Possible interactions type occurred in ligand dissociation are interatomic contact (blue/green), hydrogen bond (red), overlap (yellow), and combined (black).

