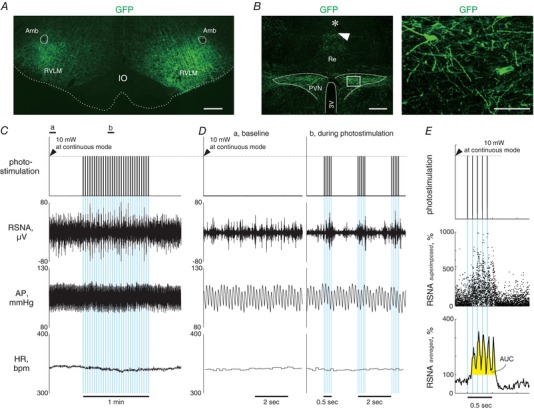
Figure 5. Representatives of fluorescence images of brain sections and photostimulation‐elicited sympathetic and cardiovascular responses in ChR2‐GFPretro rats.

A, a medullary coronal section of a ChR2‐GFPretro rat, showing AAV transductions of axonal fibres in the RVLM. Scale bar: 500 μm. B, hypothalamic coronal sections of a ChR2‐GFPretro rat showing GFP immunoreactivities as well as a scar (arrowhead) and a wreck (asterisk) due to insertions of an optical fibre (left) and microphotographs of GFP immunoreactivities in the PVN (right). The rectangular area in the left panel is magnified in the right panel. Scale bars: 500 μm (left) and 100 μm (right). C, representative traces of RSNA, AP and HR as well as the analog DC input to generate blue light output while 1 min intermittent bouts (0.5 s illumination pulses with a 1.5 s interval) of photostimulation at 10 Hz with 5 ms pulse duration was unilaterally given to the PVN (blue background), obtained from a ChR2‐GPFretro rat. Each blue background represents one bout of photostimulation given to the PVN, the width of which indicates 500 ms. D, traces at baseline and during photostimulation indicated by horizontal bars in C are magnified. Each blue background represents one photo‐pulse, the width of which is 5 ms. E, superimposing analysis performed on the data shown in C and D. The analog DC input for light output (top) and plots of 10 ms‐averaged RSNA (middle) during each cycle for 30 interventions of photostimulation, as well as the averaged RSNA on the 30 plots at each time point during a stimulation‐to‐non‐stimulation cycle (bottom). The values of area under the curve (AUC) for RSNA, an index of the response to photostimulation, were determined as the area coloured yellow.
