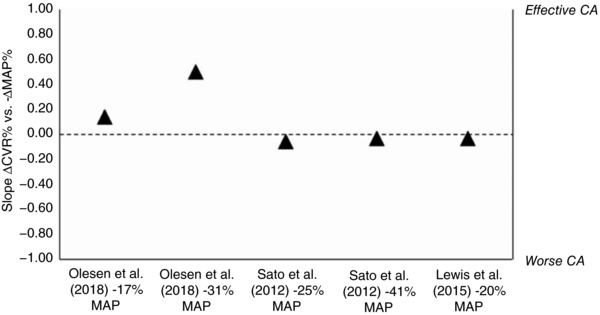
Figure 1. Summary of the key studies that have investigated cerebral blood flow changes during systemic hypotension.

The slope of cerebral autoregulation (CA) is percentage change in cerebrovascular resistance (i.e. CVR = MAP/CBF; △CVR%) and mean arterial pressure relative to baseline values (−△MAP%) and is calculated via the regression coefficient from each of the estimated equations. These values are ‘uncorrected’ for changes in arterial CO2 tension () in poikilocapnic conditions. A CA slope of 1 would correspond to complete CA (i.e. △CVR% = △MAP% for a constant CBF), and a value of 0 corresponds to no CA (i.e. △CBF% = △MAP% without any changes in CVR). The unexpected 7% increase in global CBF with modest hypotension (i.e. −17% MAP) is notable. As MAP was further reduced by −31%, the CA slope increased; these results indicate lower CVR for a given decrease in MAP. Lastly, the results by Sato et al. (2012) and Lewis et al. (2015) indicate less effective CA during the respective reductions in MAP.
