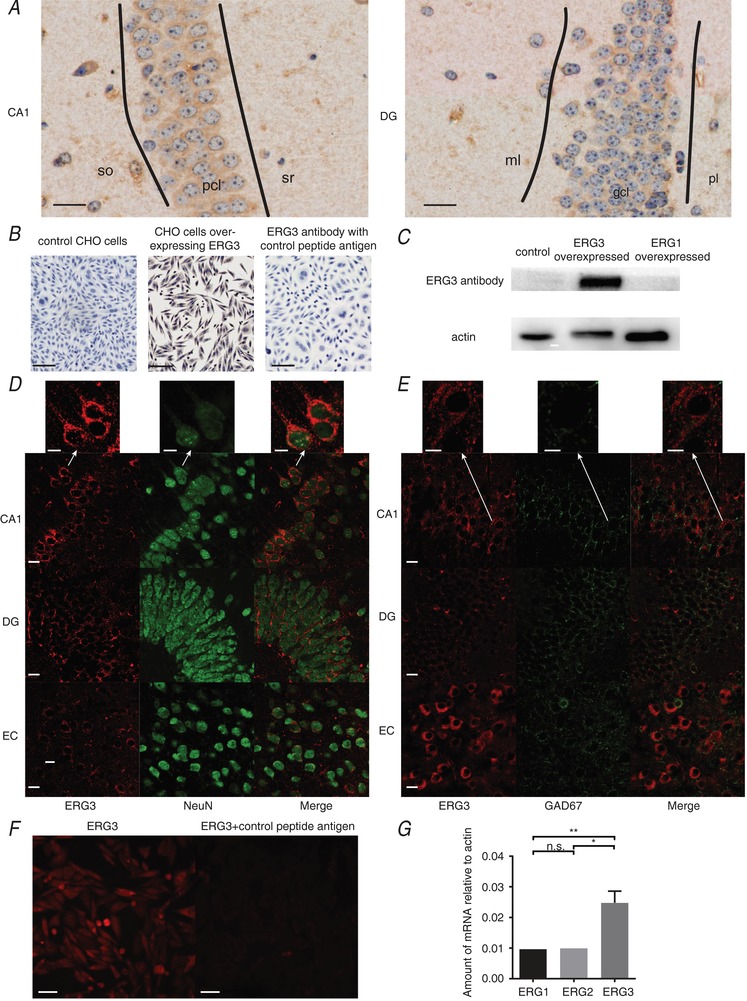
Figure 1. ERG3 protein is expressed in hippocampus.

A, IHC images showing the expression of the ERG3 protein in DG and CA1 areas of the mouse hippocampus. Scale bar, 20 μm. gcl, stratum granulosum; ml, stratum moleculare; pcl, stratum pyramidale layer; pl, polymorphic layer; so, stratum oriens; sr, stratum radiatum. B, IHC images showing CHO cells overexpressing ERG3 are heavily stained with ERG3 antibody, while control CHO cell and the negative control groups show almost no stain at all. IHC and image capturing conditions are identical in these groups. Scale bar, 50 μm. C, western blot analysis of HEK‐293 cells with ERG3 overexpression, ERG1 overexpression and control group. D, double IF staining for ERG3 (red) and NeuN (green) in entorhinal cortex and hippocampal DG and CA1 regions of mice. Scale bar, 10 μm. Arrows show a magnified image, indicating ERG3 protein is expressed in the cytoplasm and proximal part of apical dendrites of neurons. E, double staining of ERG3 (red) and GAD67 (green) in entorhinal cortex and hippocampal DG and CA1 regions of mice. Scale bar, 10 μm. Arrows show magnified images, indicating most ERG3 positive cells lack staining for GAD67. F, IF staining of ERG3‐overexpressing CHO cells with the ERG3 antibody and the antibody incubated with control antigen. IF and image capturing conditions are identical in these two groups. G, quantification of real‐time RT qPCR experiment of hippocampal tissues obtained from control mice. n = 9 from 9 mice; n.s., P > 0.05; * P < 0.05; ** P < 0.01; ordinary one‐way ANOVA with Tukey's multiple comparison test. Data are presented as means ± SEM.
