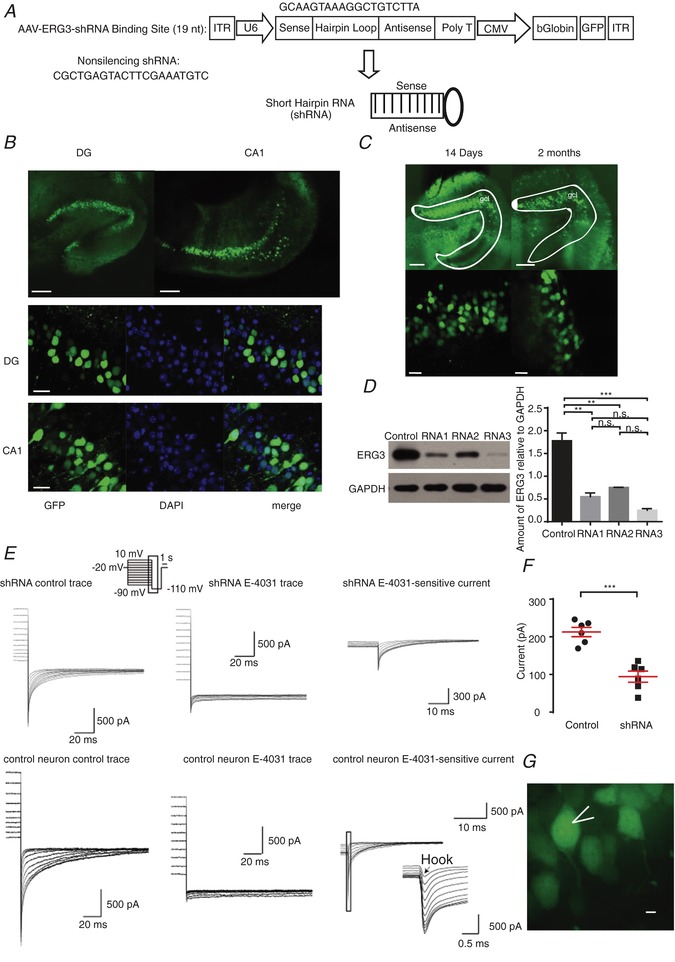
Figure 2. Injection of AAV carrying ERG3 shRNA significantly decreased the expression of ERG3 channels.

A, schematic diagram showing the lentiviral shRNA expression vector system. The 19‐nucleotide shRNA is specific to the mouse ERG3 mRNA. B, GFP fluorescence showing the expression of AAV in DG and CA1 areas. The rate of successful transduction was measured by the ratio of GFP positive cells to the DAPI positive cells. Scale bar, 100 μm (upper panels), 25 μm (lower panels). C, expression of AAV over time in the dorsal hippocampal DG area. Scale bar, 100 μm (upper panels), 20 μm (lower panels). gcl, DG stratum granulosum. D, western blotting and quantification showing ERG3 expression levels were reduced after the injection of ERG3‐shRNA. n.s., P > 0.05; ** P < 0.01; *** P < 0.001; ordinary one‐way ANOVA. The protein level of shRNA no. 3 group showed a significant decrease compared with control group, and the significance level was P < 0.001 (Dunnett's and Tukey's multiple comparison test). E, representative ERG current traces recorded in different cells from control mice and mice transduced with ERG3‐shRNA. The ERG‐mediated current was obtained by subtracting the E‐4031 (ERG channel blocker) trace from control trace. Note that the ERG current is significantly smaller in mice transduced with ERG3‐shRNA than control mouse. F, quantification of the tail current amplitudes recorded in different cells from control mice and mice transduced with ERG3‐shRNA. The amplitude is calculated by subtracting the tail current from the steady state current and the tail current is measured at 5 ms after the voltage was changed to −110 mV. n = 6 neurons from 5 control mice; n = 6 neurons from 3 ERG3‐shRNA injected mice. *** P < 0.001, unpaired two‐tailed Student's t test. G, representative morphological images of ERG3‐shRNA‐transduced rat DG neurons. Scale bar, 5 μm. Data are presented as means ± SEM.
