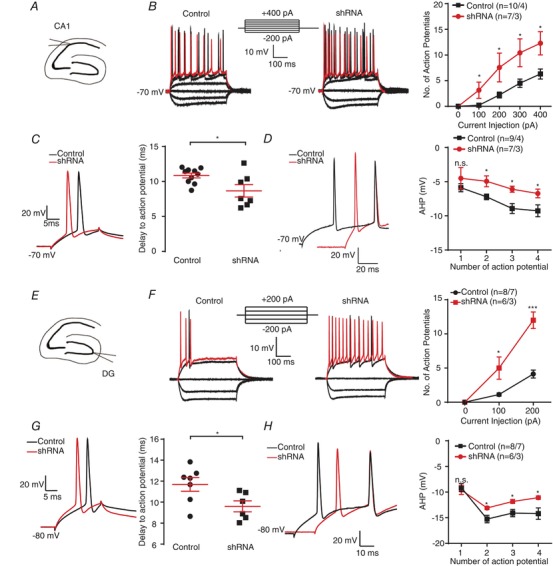
Figure 3. Knocking down ERG3 protein significantly enhanced neuronal intrinsic excitability.

A, schematic diagram of CA1 region. B, representative current‐clamp recordings obtained from normal control (left) and ERG3‐shRNA tranduced mouse CA1 neurons (right). A series of 400 ms hyperpolarizing and depolarizing steps in 100 pA increments were applied to produce the traces. For comparison, the cells were held at −70 mV membrane potential. The mean numbers of action potentials generated in the response of depolarizing current pulses are shown in the right panel. The 400 pA current trace is shown in red. These data were recorded from 10 neurons from 4 control mice, and 7 neurons from 3 ERG3‐shRNA injected mice. * P < 0.05, unpaired two‐tailed Student's t test. C, typical action potential traces (left) and the delay to action potential (right) obtained from control and ERG3‐shRNA‐transduced mouse CA1 neurons. n = 10 neurons from 4 control mice; n = 7 neurons from 3 ERG3‐shRNA injected mice. * P < 0.05, unpaired two‐tailed Student's t test. D, representative traces of CA1 neurons from normal control and ERG3‐shRNA‐transduced mice in response to 300 pA positive current injection (left). The averaged fast afterhyperpolarization (AHP) of first to fourth action potential recorded in CA1 neurons from normal control and ERG3‐shRNA‐transduced mice (right). n = 9 neurons from 4 control mice; n = 7 neurons from 3 ERG3‐shRNA injected mice. * P < 0.05, unpaired two‐tailed Student's t test. E, schematic diagram of DG region. F, representative current‐clamp recordings obtained from normal control (left) and ERG3‐shRNA‐transduced mouse DG neurons (right). A series of 400 ms hyperpolarizing and depolarizing steps in 100 pA increments were applied to produce the traces. For comparison, the cells were held at −80 mV membrane potential. The mean number of action potentials generated in the response of depolarizing current pulses is shown in the right panel. The 200 pA current trace is shown in red. n = 8 neurons from 7 control mice; n = 6 neurons from 3 ERG3‐shRNA injected mice. * P < 0.05, *** P < 0.001, unpaired two‐tailed Student's t test. G, typical spikes (left) and the delay to action potential (right) obtained from control and ERG3‐shRNA‐transduced mouse DG neurons. n = 7 neurons from 6 control mice; n = 6 neurons from 3 ERG3‐shRNA injected mice. * P < 0.05, unpaired two‐tailed Student's t test. H, left, representative traces of DG neurons from normal control and ERG3‐shRNA‐transduced mice in response to 200 pA positive current injection. Right, the averaged fast afterhyperpolarization (AHP) of first to fourth action potential recorded in CA1 neurons from normal control and ERG3‐shRNA infected mice. n = 8 neurons from 7 control mice; n = 6 neurons from 3 ERG3‐shRNA injected mice. * P < 0.05, unpaired two‐tailed Student's t test. Data are presented as means ± SEM. [Color figure can be viewed at http://wileyonlinelibrary.com]
