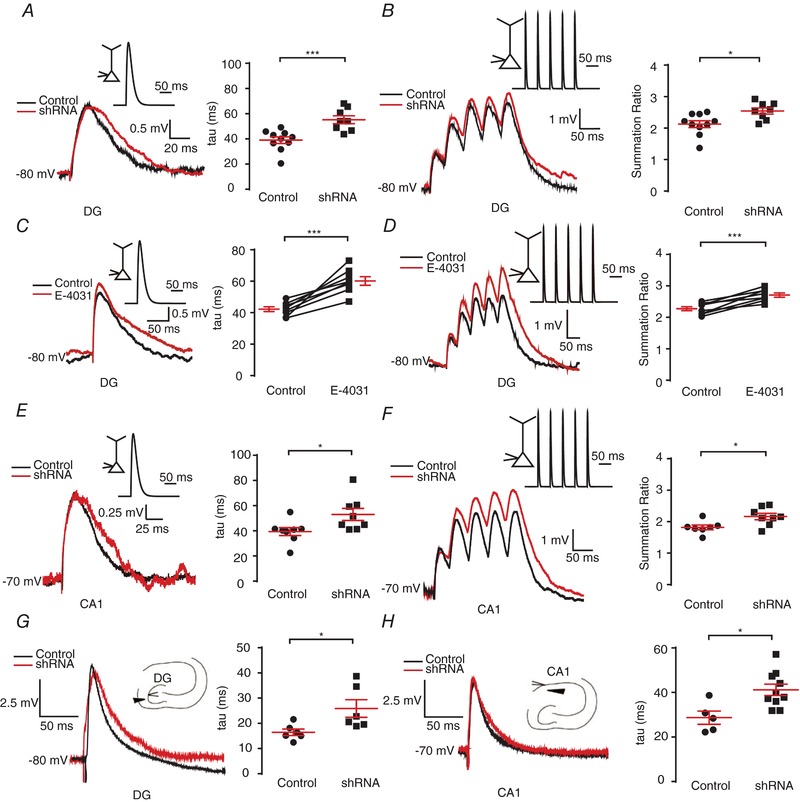
Figure 5. ERG3 deficiency leads to increased EPSPs summation.

A and B, single (A) and 20 Hz trains (B) of αEPSPs were generated by current injection (see Methods) at the soma of DG neurons from normal control and ERG3‐shRNA‐transduced mice. All recordings were obtained at a fixed potential of −80 mV. The average decay time constant (τ, obtained by fitting a two‐exponential equation to the decay phase; see Methods) of single αEPSPs and the mean summation ratio (ratio of amplitude of 5th αEPSP to 1st αEPSP) of 20 Hz trains of αEPSPs obtained in normal control and ERG3‐shRNA‐transduced mice are shown in the panels on the right. Each trace is an average of 3 traces. n = 10 neurons from 6 control mice; n = 8 neurons from 3 ERG3‐shRNA‐injected mice. * P < 0.05, *** P < 0.001, unpaired two‐tailed Student's t test. C and D, single (C) and 20 Hz trains (D) of αEPSPs were generated by current injection (see Methods) at the soma of DG neurons with or without the presence of E‐4031. All recordings were obtained at a fixed potential of −80 mV. The average decay time constant (τ, obtained by fitting a two‐exponential equation to the decay phase) and amplitude (obtained by fitting a two‐exponential equation to the decay phase) of single αEPSPs and the mean summation ratio (ratio of amplitude of 5th αEPSP to 1st αEPSP) of 20 Hz trains of αEPSPs obtained with or without the presence of E‐4031 are shown on the panels on the right. Each trace is an average of three traces. n = 7 neurons from 5 mice were recorded. *** P < 0.001, paired two‐tailed Student's t test. E‐F, Single (E) and 20 Hz (F) trains of αEPSPs were generated by current injection (see Methods) at the soma of CA1 neurons from normal control and ERG3‐shRNA‐transduced mice. All recordings were obtained at a fixed potential of −70 mV. The average decay time constant (τ, obtained by fitting a two‐exponential equation to the decay phase; see Methods) of single αEPSPs and the mean summation ratio (ratio of amplitude of 5th αEPSP to 1st αEPSP) of 20 Hz trains of αEPSPs obtained in normal control and ERG3‐shRNA‐transduced mice are shown in the panels on the right. Each trace is an average of 3 traces. n = 8 neurons from 3 control mice; n = 7 neurons from 3 ERG3‐shRNA‐injected mice. * P < 0.05, unpaired two‐tailed Student's t test. G, fibre stimulation‐evoked EPSP in DG granule cells (left), and the quantification of decay time constant (right). The relative position of stimulation electrode and recorded neuron is shown in the schematic diagram. Each trace is an average of 10 traces. The decay time constants were obtained by fitting single‐exponential equation to the decay phase. * P < 0.05, unpaired two‐tailed Student's t test. H, fibre stimulation‐evoked EPSP in CA1 pyramidal neurons (left), and the quantification of decay time constant (right). The relative position of stimulation electrode and recorded neuron is shown in the schematic diagram. Each trace is an average of 10 traces. The decay time constants were obtained by fitting single‐exponential equation to the decay phase. * P < 0.05, unpaired two‐tailed Student's t test. Data are presented as means ± SEM. [Color figure can be viewed at http://wileyonlinelibrary.com]
