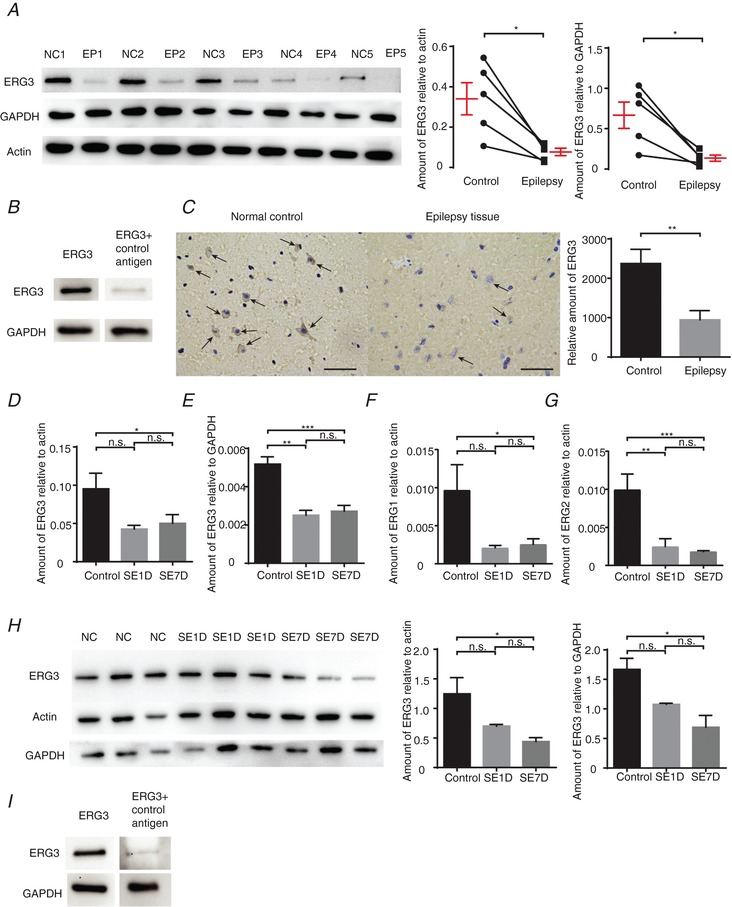
Figure 6. The expression of the ERG3 protein is down‐regulated in temporal lobe epilepsy.

A, left, western blot analysis of ERG3 protein in the hippocampus from human epilepsy patient (EP) hippocampal tissues and adjacent normal control (NC) tissues. Right, quantification of the results by normalizing the protein levels of ERG3 to that of GAPDH and actin in EP and NC groups (n = 5). * P < 0.05, paired two‐tailed Student's t test. B, western blot analysis of ERG3 protein in the hippocampus from human patients with ERG3 antibody and control antigen. C, IHC results showing ERG3 protein was decreased in the human epilepsy tissues and adjacent normal control tissues (left), and quantification (right). Scale bar, 50 μm. n = 3, ** P < 0.01, paired two‐tailed Student's t test. Arrows suggest ERG3 protein is expressed in the cytoplasm of neurons. D and E, hippocampal tissues were obtained from control mice or kainic model mice 1 day after status epilepticus (SE1D) or 7 days after status epilepticus (SE7D). For these tissues, the mRNA and protein levels of ERG3 were examined by real‐time RT‐PCR, and the ERG3 mRNA level had decreased compared with GAPDH (right) and actin (left). n = 3 from 3 mice in control group; n = 5 from 5 mice in SE1D group; n = 4 from 4 mice in SE7D group. n.s., P > 0.05; * P < 0.05; ** P < 0.01; *** P < 0.001, ordinary one‐way ANOVA with Tukey's multiple comparison test. F and G, mouse tissue was also examined by real‐time RT‐PCR for the mRNA level of ERG1 (F) and ERG2 (G). n = 9 from 9 mice were used in each group. n.s., P > 0.05; * P < 0.05; ** P < 0.01; *** P < 0.001; ordinary one‐way ANOVA with Tukey's multiple comparison test. H, mouse tissue was also examined by western blot analysis (left) and quantified (right). n = 3 from 3 mice were used in each group. n.s., P > 0.05; * P < 0.05; ordinary one‐way ANOVA with Tukey's multiple comparison test. I, western blot analysis of ERG3 protein in the mouse tissue with ERG3 antibody and control antigen. Data are presented as means ± SEM. [Color figure can be viewed at http://wileyonlinelibrary.com]
