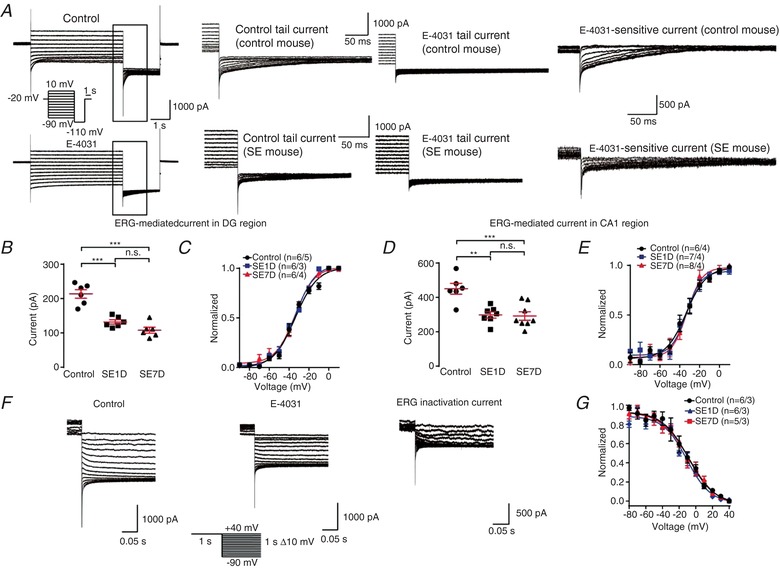
Figure 7. Functional ERG‐mediated current is significantly reduced in kainic acid‐induced epilepsy model mouse neurons.

A, representative ERG current traces recorded in different cells from control mice and kainic acid model (SE) mice. From a holding potential of −20 mV, channel activation was assessed by 4 s test pulses between −90 and +10 mV with 10 mV increments, followed by a constant pulse to −110 mV (see pulse diagram). The ERG‐mediated current was obtained by subtracting the E‐4031(ERG channel blocker) trace from control trace. Note that the ERG current is significantly smaller in SE mouse than control mouse. B, quantification of the tail current amplitudes recorded in DG region. The amplitude was calculated by substracting the tail current from the steady state current and the tail current was measured at 5 ms after the voltage was changed to −110 mV. The ERG currents were calculated by subtracting the current 5 ms after the time of voltage change from the steady state current. n = 5 neurons from 5 control mice; n = 5 neurons from 3 SE1D mice; n = 6 neurons from 4 SE7D mice. n.s., P > 0.05; *** P < 0.001; ordinary one‐way ANOVA with Tukey's multiple comparison test. C, tail current amplitudes recorded in DG region plotted against the potential of the preceding test pulse. Data were normalized to the maximum tail current amplitudes, averaged and fitted with a Boltzmann function to yield activation curves. The V 0.5 for the control, SE1D and SE7D groups are −33.65 ± 1.37, −33.74 ± 0.89 and −33.97 ± 1.36 mV, respectively. There is no significant difference between three groups. n = 5 neurons from 5 control mice; n = 5 neurons from 3 SE1D mice; n = 6 neurons from 4 SE7D mice. D, quantification of the tail current amplitudes recorded in CA1 region. The amplitude was calculated by substracting the tail current from the steady state current and the tail current was measured at 5 ms after the voltage was changed to −110 mV. n = 6 neurons from 4 control mice; n = 7 neurons from 4 SE1D mice; n = 8 neurons from 4 SE7D mice. n.s., P > 0.05; ** P < 0.01; *** P < 0.001; ordinary one‐way ANOVA with Tukey's multiple comparison test. E, peak tail current amplitudes recorded in CA1 region plotted against the potential of the preceding test pulse. Data were normalized to the maximum tail current amplitudes, averaged and fitted with a Boltzmann function to yield activation curves. The V 0.5 for the control, SE1D and SE7D groups are −33.47 ± 1.97, −33.25 ± 1.72 and −32.67 ± 1.79 mV, respectively. There is no significant difference between the three groups. n = 6 neurons from 4 control mice; n = 7 neurons from 4 SE1D mice; n = 8 neurons from 4 SE7D mice. F, a representative of fully activated ERG currents recorded in different cells from control mice and kainic acid model (SE) mice. ERG currents were elicited by 1 s depolarizations to +40 mV, followed by variable 1 s test pulses from +40 to −90 mV with 10 mV decrements (see pulse diagram). G, normalized current amplitudes of the experiments were used to calculate the relative conductance as a measure of the voltage dependence of ERG steady‐state inactivation. Data were normalized to the conductance value at −90 mV before averaging and fitted with a Boltzmann function to yield inactivation curves. The V 0.5 for the control, SE1D and SE7D groups are −8.86 ± 2.73, −7.74 ± 3.40 and −10.63 ± 2.12 mV, respectively. There is no significant difference in fitting results between the three groups. n = 6 neurons from 3 control mice; n = 6 neurons from 3 SE1D mice; n = 5 neurons from 4 SE7D mice. Data are presented as means ± SEM. [Color figure can be viewed at http://wileyonlinelibrary.com]
