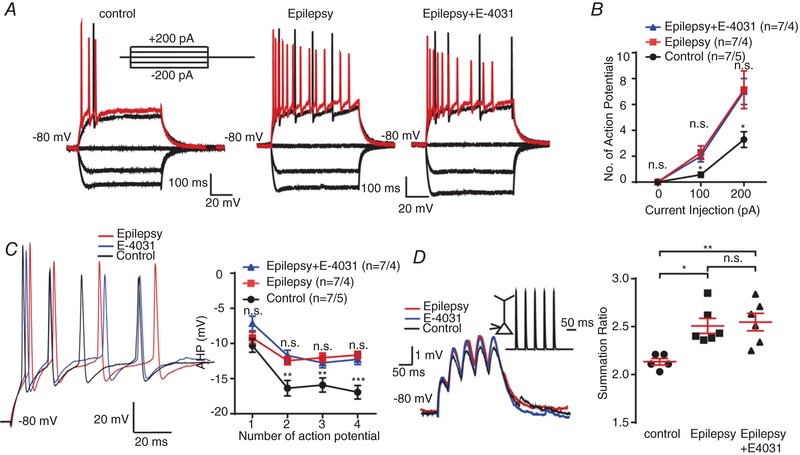
Figure 8. The function of ERG channels was impaired in kainic model mice.

A and B, representative current‐clamp recordings obtained from control mouse (right) and epilepsy mouse DG granule cells with (left) or without (middle) the presence of E‐4031. A series of 400 ms hyperpolarizing and depolarizing steps in 100 pA increments were applied to produce the traces. For comparison, the cells were held at −80 mV membrane potential. The mean number of action potentials generated in the response of depolarizing current pulses is shown in B. n = 7 neurons from 4 epilepsy model mice; n = 7 neurons from 5 control mice. n.s., P > 0.05; * P < 0.05; one‐way ANOVA with Tukey's multiple‐comparison test. According to the multiple‐comparison test, the neuronal excitability did not alter after the application of E‐4031, while the ANOVA of control, epilepsy and epilepsy+E‐4031 groups showed significant change of neuronal excitability. C, left, representative traces of DG neurons from control mice (black) and epilepsy model mice with (blue) or without (red) the presence of E‐4031 in response to 200 pA positive current injection. Right, the quantification of averaged fast afterhyperpolarization (AHP) of first to fourth action potential recorded in control and epilepsy mouse DG granule cells (right panel). n = 7 neurons from 4 epilepsy model mice; n = 7 neurons from 5 control mice. n.s., P > 0.05; ** P < 0.01; *** P < 0.001; one‐way ANOVA with Tukey's multiple‐comparison test. According to multiple‐comparison test, the fAHP did not alter after the application of E‐4031, but in the second, third and fourth action potentials, the ANOVA of control, epilepsy and epilepsy+E‐4031 groups showed significant change of fAHP. D, 20 Hz trains of αEPSPs were generated by current injection at the soma of DG neurons in control (black) and epilepsy mouse DG granule cells with (blue) or without (red) the presence of E‐4031. All recordings were obtained at a fixed potential of −80 mV. The mean summation ratio (ratio of the amplitude of 5th αEPSP to 1st αEPSP) of 20 Hz trains of αEPSPs are shown in the panel on the right. Each trace is an average of three traces. n = 5 from 3 control mice; n = 6 neurons from 4 epilepsy model mice. n.s., P > 0.05; * P < 0.05; ** P < 0.01; ordinary one‐way ANOVA with Tukey's multiple‐comparison test. Data are presented as means ± SEM. [Color figure can be viewed at http://wileyonlinelibrary.com]
