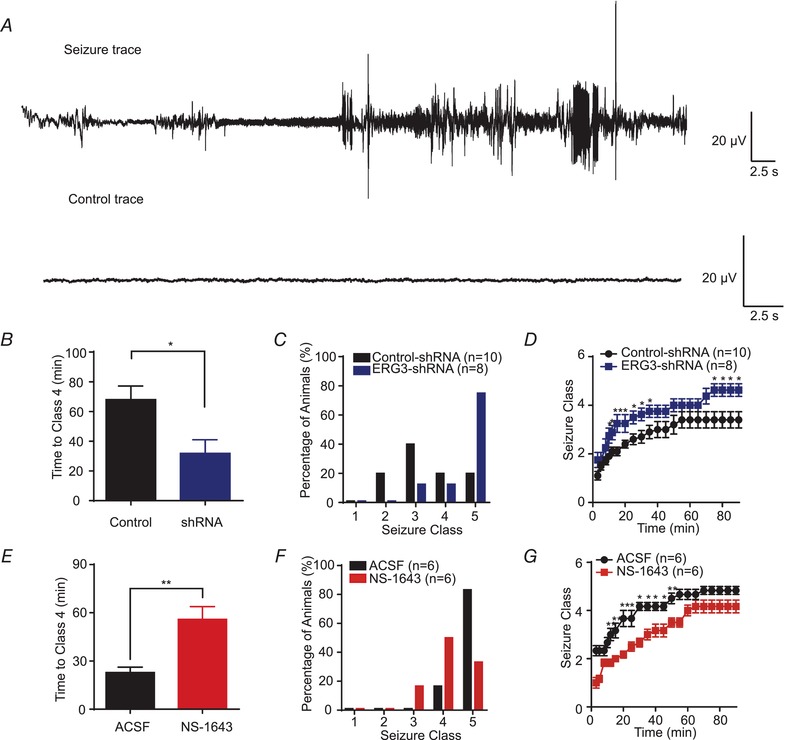
Figure 9. ERG3 suppresses seizure susceptibility in temporal lobe epilepsy.

A, examples of in vivo EEG recordings obtained from ERG3‐shRNA‐transduced and wild‐type mice. B, graph depicting the time taken to reach class 4 seizure after kainic acid (KA) administration from ERG3‐shRNA‐transduced and wild‐type mice. * P < 0.05, unpaired two‐tailed Student's t test. C, the incidence of maximum seizure class reached during the course of the experiments in D. D, graph depicting the seizure progression in ERG3‐shRNA‐transduced and wild‐type mice, illustrated as mean maximum seizure class (defined by Racine scale, see Methods) reached in different time points after KA administration. * P < 0.05, unpaired two‐tailed Student's t test. E, graph depicting the time taken to reach class 4 seizure after KA administration from NS‐1643‐injected and wild‐type mice. ** P < 0.01, unpaired two‐tailed Student's t test. F, the incidence of maximum seizure class reached during the course of the experiments in G. G, graph depicting the seizure progression in NS‐1643 (ERG channel opener) injected and wild‐type mice, illustrated as mean maximum seizure class reached in different time points after KA administration. * P < 0.05; ** P < 0.01; unpaired two‐tailed Student's t test. Data are presented as means ± SEM. [Color figure can be viewed at http://wileyonlinelibrary.com]
