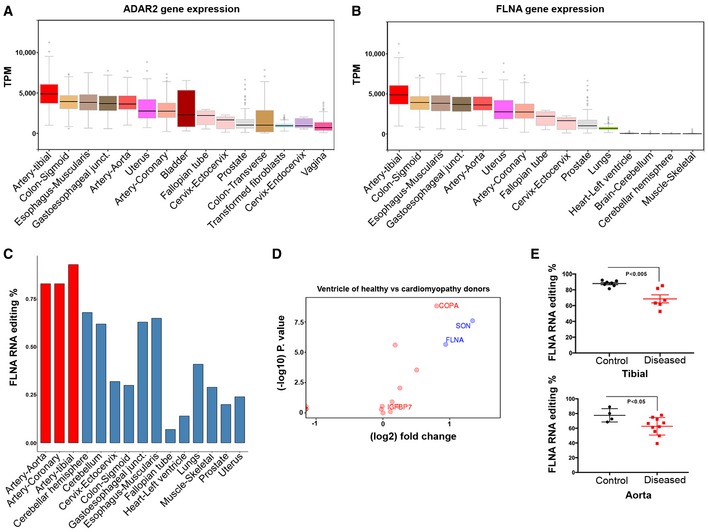
Figure 1. FLNA editing in cardiac patients from GTEx donors.

- ADAR2 is most strongly expressed in vascular tissues. Graph showing ADAR2 gene expression data derived from GTEx for few representative human tissues. Note the highest expression of ADAR2 in the tibial artery followed by colon and esophagus. Boxes represent the 25th and the 75th percentile with median represented by the black line in the box. The whiskers depict the minimum and the maximum value.
- FLNA gene expression in few representative human tissues from > 500 different donors using GTEx data. Tibial artery, colon, and esophagus show highest gene expression similar to ADAR2 expression. Boxes represent the 25th and the 75th percentile with median represented by the black line in the box. The whiskers depict the minimum and the maximum value.
- Bar graph shows FLNA RNA editing (%) among few representative human tissues. Note very high editing levels in the arterial system (red bars).
- Scatter plot shows the log fold change in editing levels of several candidates between ventricles of healthy donors and heart samples of cardiomyopathy patients. FLNA marked in the graph is one significant discriminator. Y‐axis is the −log 10 of the P‐value for the difference between healthy and sick. The colors (red vs. green) reflect the threshold cutoffs randomly assigned to distinguish the sites, which demonstrate large, highly significant differences between the two groups. Fold change cutoff of 0.9 was used.
- Scatter plot shows the FLNA RNA editing in control and diseased human tibial arteries and aortae. At least four control and seven diseased human donors were used in each case. P‐value < 0.05 measured by t‐test was considered significant.
Source data are available online for this figure.
