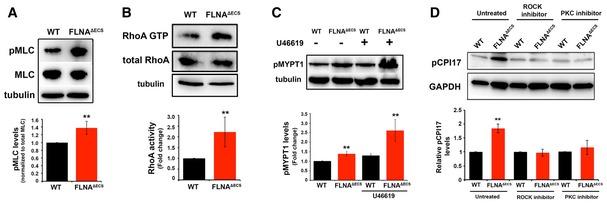
Figure 4. FLNA Δ ECS vSMCs have increased Rho and ROCK activity and myosin phosphorylation.

- Myosin light chain phosphorylation detected by a phospho‐specific antibody (pMLC) and normalized to total myosin light chain (MLC). Tubulin served as a loading control. Quantification shows a significant increase in pMLC in FLNAΔECS vSMCs.
- Rhotekin pull‐down activation assay was performed on wt and FLNAΔECS vSMC lysates, and activated GTP‐bound RhoA was compared between the two genotypes. FLNAΔECS vSMCs show more GTP‐loaded RhoA than wt vSMCs. Tubulin was used as a loading control.
- Thromboxane A2 stimulation with U46619 increased phosphorylation of myosin light chain phosphatase (pMYPT1) in FLNAΔECS vSMCs as shown by Western blotting on vSMC lysates with phospho‐specific MYPT1 antibody.
- CPI17 phosphorylation levels were measured in wt and FLNAΔECS vSMCs in untreated cells and in the presence of ROCK and PKC inhibitor using pCPI17 antibody.
