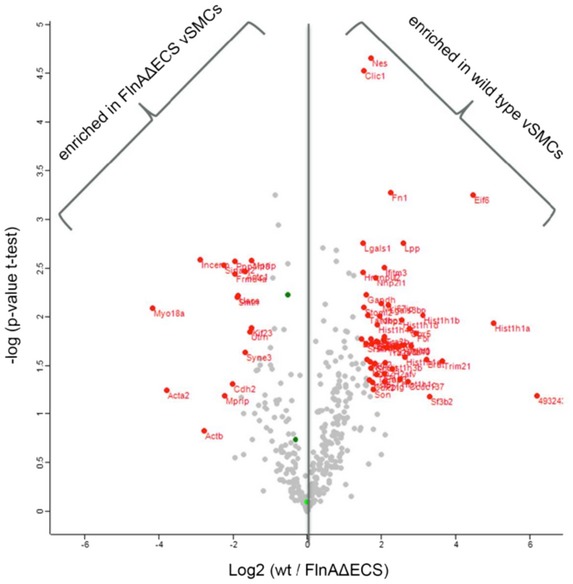
Figure EV4. Volcano plot.

- Volcano plot presenting proteins differentially enriched in either of the two sets of Filamin A pull‐down from FLNAΔECS and wild‐type vSMCs. X‐axis represents mean log2 ratio of protein intensities between the two sets, plotted against the negative logarithm of the P‐value from triplicate t‐tests. Proteins marked in red on the left side of central line were enriched in FLNAΔECS vSMCs pull‐downs while the ones on the right side were enriched in wild‐type vSMC pull‐downs (P < 0.05; fold change > 2; modified Student's t‐test). Total counts were first normalized to Filamin A in each data set.
