
Figure 7. Blood velocity profiling in FLNA Δ ECS and wt mice.
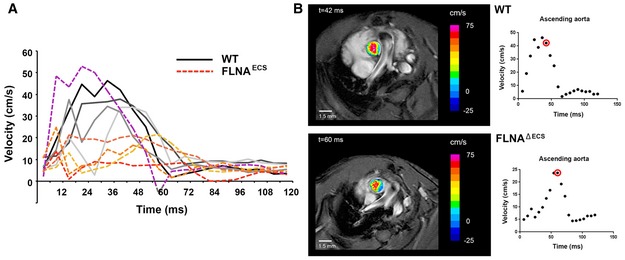
- Graph shows the individual blood velocity profile determined by MRI over time in 4 wt mice (shades of gray) and 5 FLNAΔECS mice (shades of red). The mouse shown in dotted purple line is clearly an outlier within the FLNAΔECS cohort. Aortic velocity waveform represents velocity during different stages of cardiac cycle. A significant reduction in velocity was observed at 40 ms in the systolic cycle.
- Representative wt (top) and FLNAΔECS (below) mice showing the blood flow just above the aortic valve. Note: Reduced blood flow in FLNAΔECS mouse as depicted by pseudocoloring. The red circle represents the time window at which the images are shown.