
Figure EV3. Transcriptional silencing in the wild type and the arid2/3/4 and epcr1/2 mutant seedlings at different development stages.
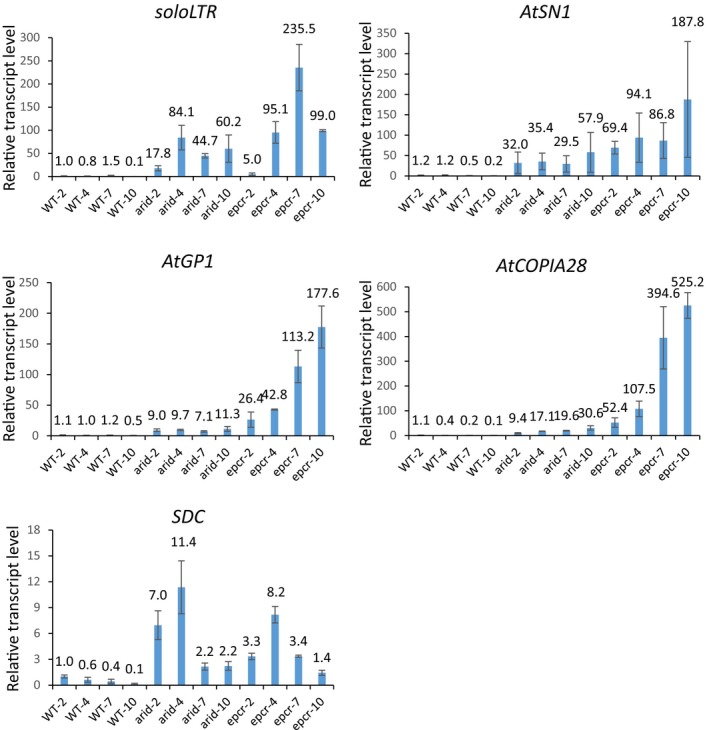
Transcript levels of solo LTR, AtSN1, AtGP1, AtCOPIA28, and SDC in the wild type and the ARID2/3/4, and epcr1/2 mutant seedlings grown for 2, 4, 7, and 10 days after germination. Shown are transcript levels of indicated loci, as determined by qPCR analysis. Error bars represent SD from three independent biological replicates.