
Figure 4. ARID2/3/4 and EPCR1/2 are required for transcriptional silencing.
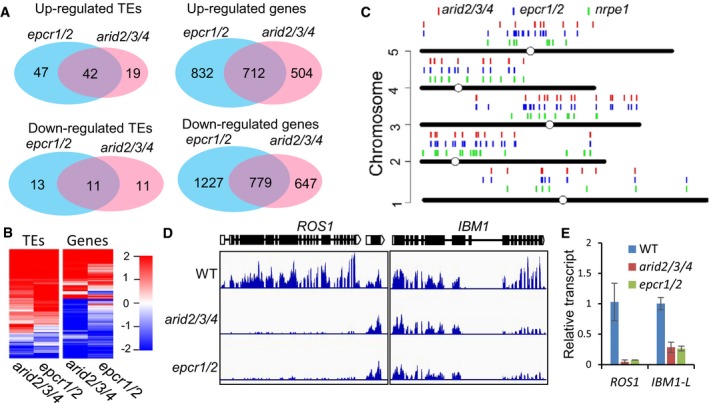
- Venn diagrams showing up‐ and downregulated genes and TEs in the epcr1/2 and arid2/3/4 mutants relative to the wild type, as determined by RNA‐seq. The data are from three independent biological replicates. All the overlaps are highly significant (P < 2.6 × 10⁻³⁰) as determined by hypergeometric test.
- Heat maps showing differentially transcribed genes and TEs in the arid2/3/4 and epcr1/2 mutants relative to the wild type.
- Distribution of upregulated TEs in nrpe1, epcr1/2, and arid2/3/4 on the Arabidopsis chromosomes.
- Genome browser snapshots showing the transcript patterns of ROS1 and IBM1 in arid2/3/4 and epcr1/2 relative to the wild type.
- Effects of arid2/3/4 epcr1/2 on the transcript levels of ROS1 and IBM1‐L as determined by qPCR. The expression of ROS1 and the longer version of IBM1 (IBM1‐L) was evaluated by qPCR. ACT7 was amplified as an internal control. Bars represent SD from two independent experiments, each with three technical replications.