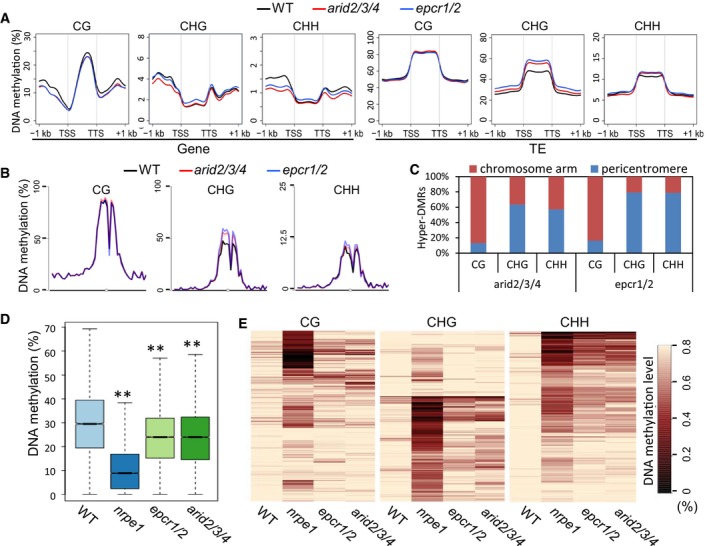
Metaplot of CG, CHG, and CHH methylation of genes and TEs in the genomes of wild‐type, epcr1/2, and arid2/3/4 plants. H indicates C, A, or T.
Metaplot of CG, CHG, and CHH methylation on chromosome 3 of Arabidopsis in wild‐type, epcr1/2, and arid2/3/4 plants.
Distribution of arid2/3/4 and epcr1/2 hyper‐DMRs of CG, CHG, and CHH sites in pericentromeric regions and two chromosome arms. A pericentromeric region refers to 6 million base pairs of a centromere‐flanking region on each chromosome.
Boxplot of DNA methylation in the wild type, nrpe1, epcr1/2, and arid2/3/4 mutants. The hypo‐DMRs identified in the nrpe1 mutant were defined as RdDM target loci. Asterisks indicate that DNA methylation is significantly (P < 0.001) decreased in the mutants as determined by paired Student's t‐test. Horizontal lines represent the median, and the bottom and top of the box represent the 25th and 75th percentile. The whiskers represent data range within 1.5× of the interquartile range.
Heat maps of CG, CHG, and CHH methylation at RdDM target loci. The hypo‐DMRs identified in the nrpe1 mutant were defined as RdDM target loci and analyzed in the wild type, nrpe1, eprc1/2, and arid2/3/4 mutants. Black and light yellow indicate low methylation and high methylation, respectively.