-
A
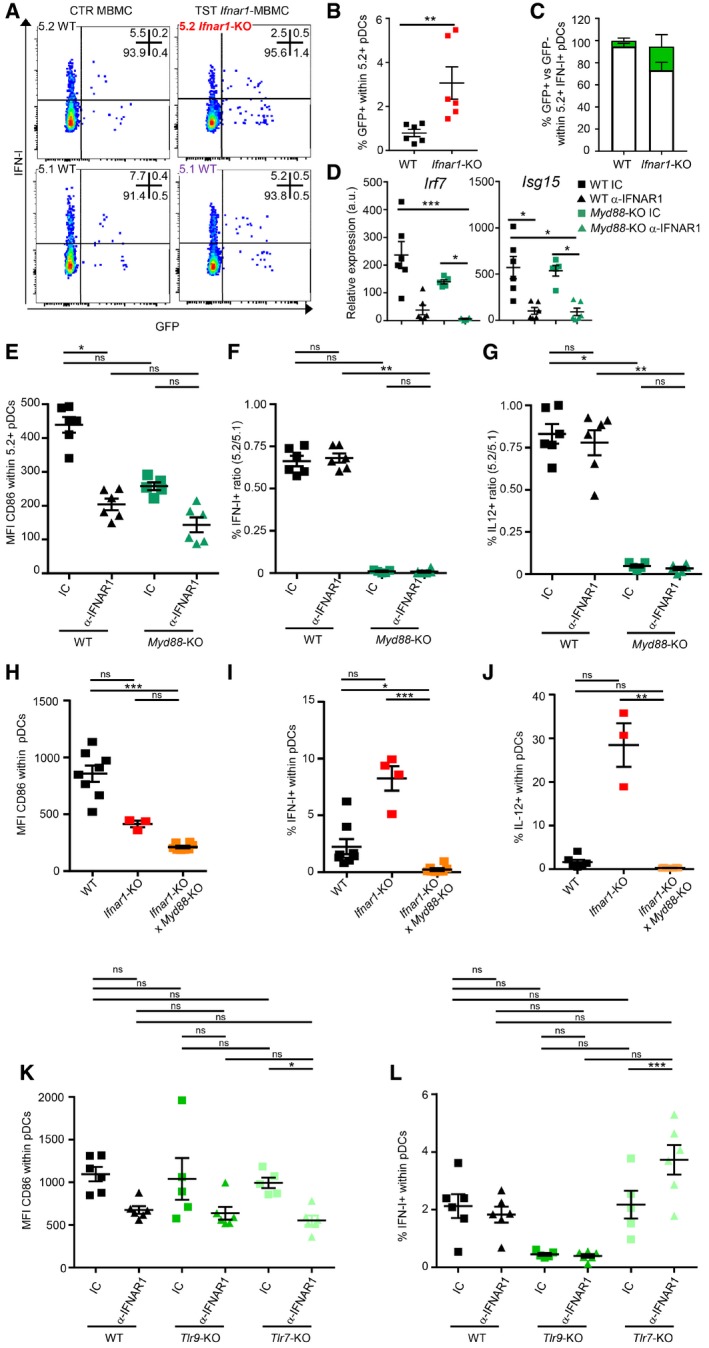
Dot plots represent IFN‐I versus GFP staining in 5.2+ versus 5.1+ pDC isolated from indicated MCMV‐GFP‐infected MBMC. One staining representative of six animals from two independent experiments is shown.
-
B, C
Percentages of GFP+ cells within 5.2+ pDC (B) or of GFP+ (green) versus GFP− (white) cells within 5.2+ IFN‐I‐producing pDC (C) isolated from indicated MCMV‐GFP‐infected MBMC. Data shown (mean ± SEM) are from two pooled independent experiments each with three mice per group.
-
D
qPCR for the expression of the indicated genes was performed on whole mRNA isolated from the spleen of indicated MCMV‐infected MBMC. CTR MBMC (black) and Myd88
−/− TST MBMC (dark green) were treated with isotype control (IC, square) or blocking α‐IFNAR1 mAbs (triangle). Data shown (mean ± SEM) are from two pooled independent experiments each with two to three mice per group.
-
E–G
CD86 MFI in 5.2+ pDC of each indicated MBMC type (E) and 5.2/5.1 ratio of cytokine‐producing pDC (F, G). Data (mean ± SEM) are representative of two pooled independent experiments each with two to three mice per group.
-
H–L
CD86 MFI (H, K) and percentages of cytokine‐producing cells (I, J and L) within pDC of each indicated mouse strain. Black, C57BL6; red, Ifnar1
−/−; orange, Ifnar1
−/− × Myd88
−/−; green, Tlr9
−/−; and pale green, Tlr7
−/−. In (K–L), indicated mice were treated with IC (square) or blocking α‐IFNAR1 mAbs (triangle). Data depicted (mean ± SEM) are from two pooled independent experiments each with two to three mice per group.
< 0.001; nonparametric Mann–Whitney test for (B), nonparametric Kruskal–Wallis test combined with Dunn's multiple correction test for (D–L).

