
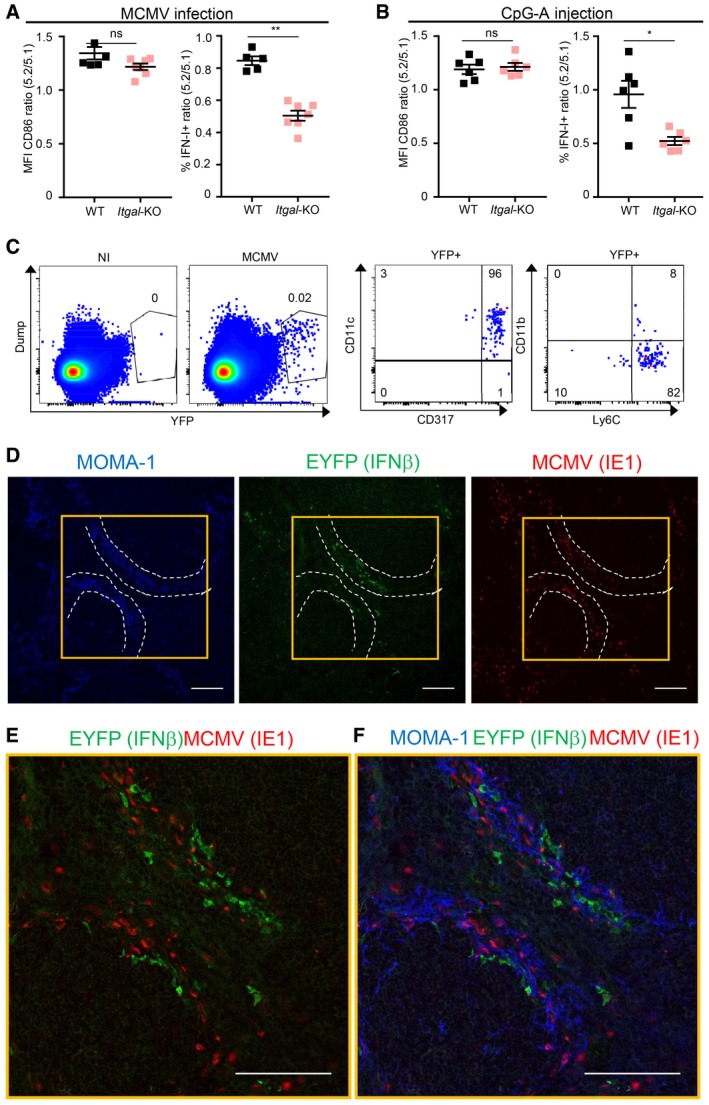
Figure 7. pDC IFN‐I production is promoted by LFA1 engagement and occurs in the vicinity of infected cells during MCMV infection.
-
A, BRatio of CD86 expression or IFN‐I production in 5.2+ versus 5.1+ pDC isolated from MCMV‐infected (A) or CpG‐stimulated (B) MBMC of each indicated type. Black, CTR MBMC; pale pink, Itgal‐TST MBMC. Data shown (mean ± SEM) are from two pooled independent experiments each with three mice per group. ns, not significant (P > 0.05); *P < 0.05; **P < 0.01; nonparametric Mann–Whitney test.
-
CEYFP expression in splenocytes isolated from uninfected (NI) versus MCMV‐infected (MCMV) IFNb tm1(EYFP) reporter mice. The expression of indicated markers was analyzed on YFP+ cells. Plots are representative of one out of six mice from two independent experiments.
-
D–FImmunohistological analysis of splenic sections stained with mAb against MOMA1/CD169 (blue), GFP/EYFP (green), whose expression correlates with that of IFN‐β, and MCMV IE‐1 (red). Scale bars, 100 μm. The image shown is one representative of 15 obtained from five different mice. Optical magnification was 20×, and images were scanned on the microscope at zoom x2 for (E, F). White dotted lines delimit marginal zone. Yellow squares in (D) defines zoomed region in (E, F).