
Figure EV4. eIF3F knockdown does not affect minigene RNA expression levels.
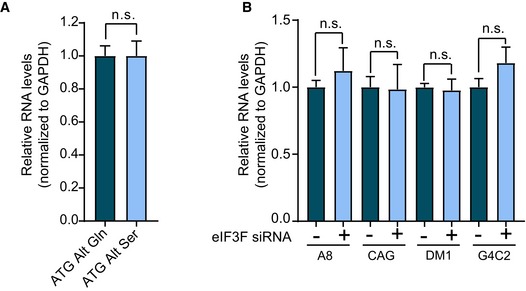
- Bar graph showing relative minigene expression measured by qRT–PCR in cells transfected with the codon replacement constructs expressing polyGln (dark blue) or polySer (light blue; n = 5, n.s. no significance; mean ± SEM; unpaired t‐test).
- Bar graph showing relative minigene expression measured by qRT–PCR in cells co‐transfected with the various repeat expansion and control (dark blue) or eIF3F (light blue) targeting siRNA (n = 5; n.s. no significance; mean ± SEM; unpaired t‐test).