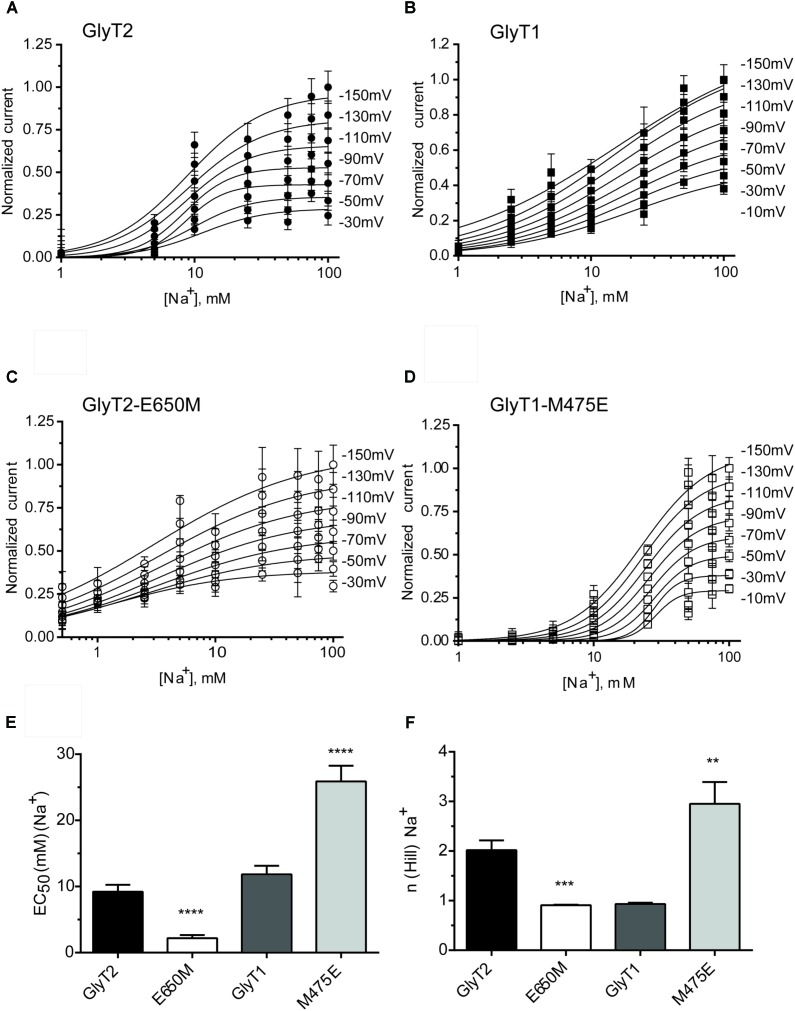
FIGURE 5.
Sodium dependence of glycine-evoked steady-state currents in the oocytes expressing GlyT2 and GlyT1 wild-type and mutants. (A–D) At least six oocytes expressing the indicated transporters were voltage-clamped at the specified clamping potentials over the range of –150 and –10 mV and glycine-induced currents at increasing external sodium concentrations (choline substitution) were measured to estimate the EC50 (E) and Hill coefficient (F). At each potential glycine-induced currents were averaged and normalized to those at –150 mV. Data were analyzed by paired t-test, comparing with wild-type GlyT1 or wild-type GlyT2. ∗∗p < 0.01; ∗∗∗p < 0.001; ∗∗∗∗p < 0.0001.

