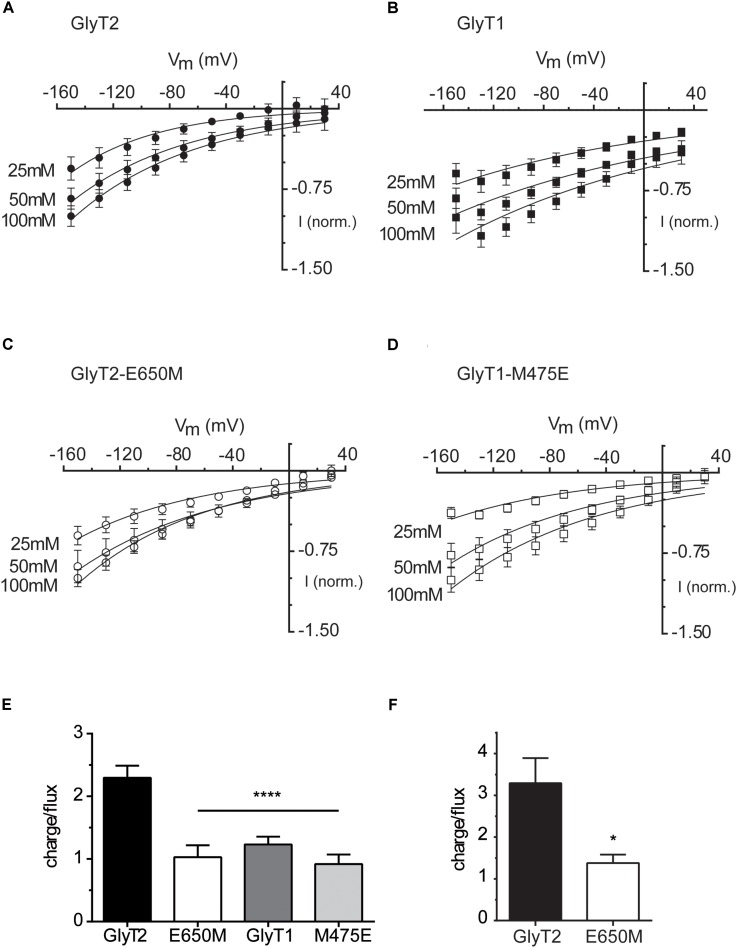
FIGURE 6.
Glycine-induced steady-state currents and charge-to-flux ratios by wild-type GlyTs and mutant transporters. (A–D) Glycine-induced currents: the membrane voltage of oocytes expressing the indicated transporters was stepped from a holding potential of –60 mV to voltages between –150 to 30 mV in –20 mV increments. Currents in 100 mM NaCl recording solution were subtracted from those in the same medium supplemented with 1 mM Gly. At each potential glycine-induced currents were averaged and normalized to those at –150 mV. These currents were then plotted against the corresponding potential (millivolt). The data are the mean ± SEM (error bars) of at least four different oocytes. Wherever error bars are not visible, the error was smaller than the size of the symbols. The mean currents at –150 mV induced by 1 mM glycine were –67.6 ± 6.7 nA in GlyT2, –34.8 ± 2.7 nA in GlyT2-E650M, –132.1 ± 19.2 nA in GlyT1, and –77.6 ± 23.9 in GlyT1-M475E. The rectification degree has been estimated as the ratio of the slopes of the linear regression fit of the three current values at the most negative and most positive potentials in the I/V curves. The calculated rectification degree at 100 mM NaCl are 4 (GlyT2), 1.75 (GlyT2-E650M), 1.3 (GlyT1), and 1 (GlyT1-M475E). (E,F) charge-to-flux ratios: oocytes expressing the indicated transporters were voltage-clamped at –60 mV (E) or –100 mV (F) in 100 mM NaCl recording solution and the current induced by 30 μM radioactive glycine (0.4 Ci/mmol) was measured for 1 min. The charge moved during this time was obtained by integrating the current over time (Clampfit v. 10.3). The ratio was determined by calculating the moles of charge and dividing by the moles of radiolabeled substrate taken up as determined from scintillation counting after correction by the values for non-injected oocytes. The data are given in mean ± SEM (error bars) of at least four different oocytes. ∗∗∗∗p < 0.0001 one-way ANOVA with Bonferroni’s multiple comparison test, ∗p < 0.05 Mann–Whitney test.

