Figure 1.

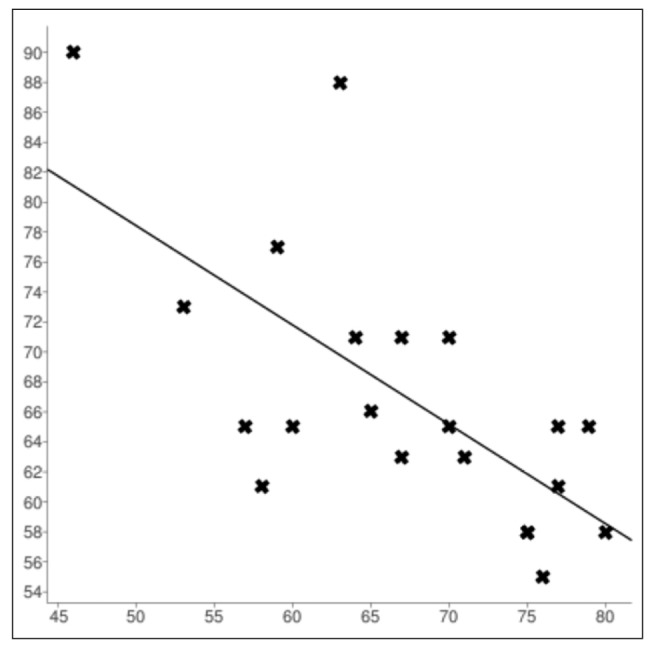
Scatter plot of the age of the patients with 2-part fracture versus Constant score, showing the line of best fit. X = age, y = Constant score

Scatter plot of the age of the patients with 2-part fracture versus Constant score, showing the line of best fit. X = age, y = Constant score