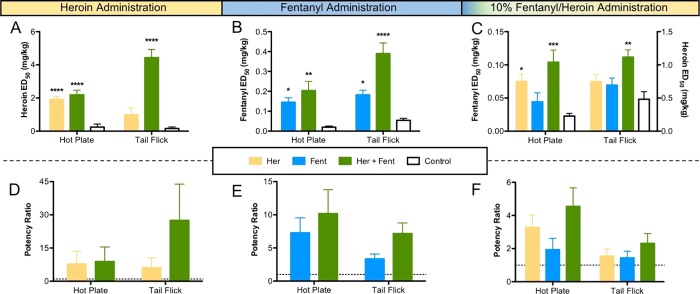
Figure 3.
Testing the efficacy of admixture vaccines against heroin, fentanyl, and a combination of drug (ip) in mice. The inset panel describes each vaccination group. (A) Results from hot plate and tail flick antinociceptive tests using heroin. (B) Results from antinociceptive tests using fentanyl. (C) Results from antinociceptive tests using 10% fentanyl in heroin. (D) Potency ratios for vaccine groups against heroin. (E) Potency ratios for vaccine groups against fentanyl. (F) Potency ratios for vaccine groups against a 10% mixture of fentanyl in heroin. Significance is denoted by an asterisk from a one-way ANOVA and a Dunnett’s post hoc test when comparing vaccinated groups to controls. **P ≤ 0.01, ***P ≤ 0.001, ****P ≤ 0.0001 vs control. The dashed lines in the potency panels denote the control levels.

