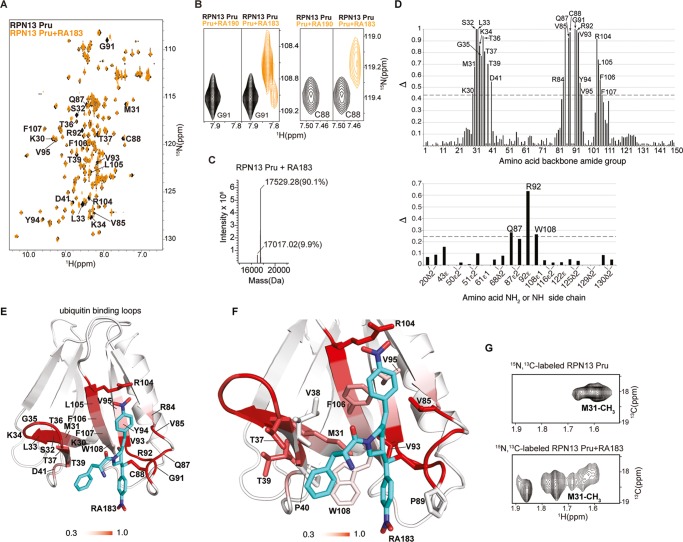
Figure 2.
RA183 adducts to RPN13 Pru domain C88, making hydrophobic interactions in a neighboring pocket. (A) (1H, 15N) HSQC spectra of 15N-labeled RPN13 Pru domain alone (black) and after incubation with 10-fold molar excess of RA183, followed by dialysis (orange). Signals affected by RA183 are labeled. (B) Comparison of RPN13 Pru domain with RA190 (left panels) and RA183 (right panels) for G91 and C88 as indicated. In contrast to RA190, which causes severe attenuation, most signals shift to an observable new location after RA183 addition, as exemplified by G91 and C88. (C) LC–MS experiment for RA183-exposed RPN13 Pru domain. Unmodified Rpn13 is present (expected molecular weight of 17 017 Da) as well as an additional species at a molecular weight shifted by 512.3 Da. The expected molecular weight shift caused by RA183 attachment is 513 Da. The sample used for this experiment is identical to (A). (D) Normalized peak intensity attenuation (Δ) of RPN13 Pru domain backbone (top) and side-chain (bottom) amide groups upon binding RA183. The dashed line indicates 1 standard deviation (SD) above average. Unassigned, overlapping, or proline groups are excluded from this analysis and indicated by *. (E) Lowest-energy structure of RPN13 Pru with RA183 adducted. The data from (D) are mapped onto an RPN13 Pru domain ribbon diagram with a red gradient, as indicated, and RA183 carbon, nitrogen, and oxygen atoms are displayed in blue, indigo, and red, respectively. (F) Expanded view of the RPN13 Pru–RA183 complex, as shown in (E) to illustrate interactions at the contact surface with key amino acids displayed and labeled. (G) Selected regions of (1H, 13C) HSQC spectra acquired on 13C-labeled RPN13 Pru domain alone (top) and after incubation with 10-fold molar excess unlabeled RA183 (bottom). The M31 methyl group splits into multiple states following RA183 addition.

