Figure 2.

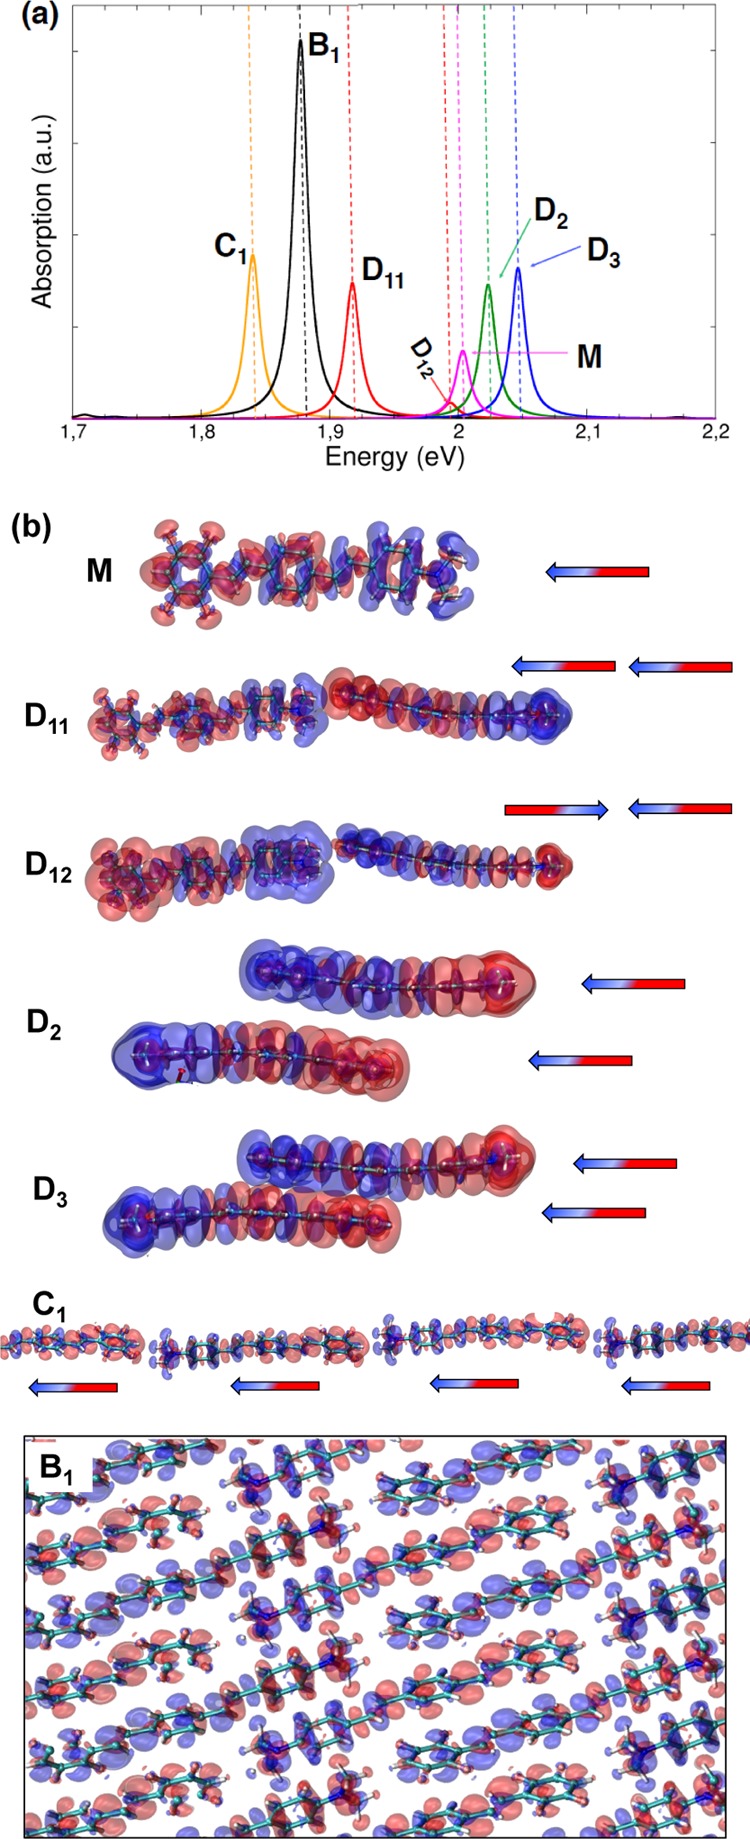
(a) TDDFT optical absorption spectra of bulk crystal (black), monomer (magenta), dimers (red, green, blue), and linear chain (ochre) arrangements taken into account. (b) Induced charge density isosurfaces associated with the different absorption peaks selected in the spectra shown in panel (a). The accompanying arrows represent dipole toy models to get a simplified representation of the interaction between the induced charge densities.
