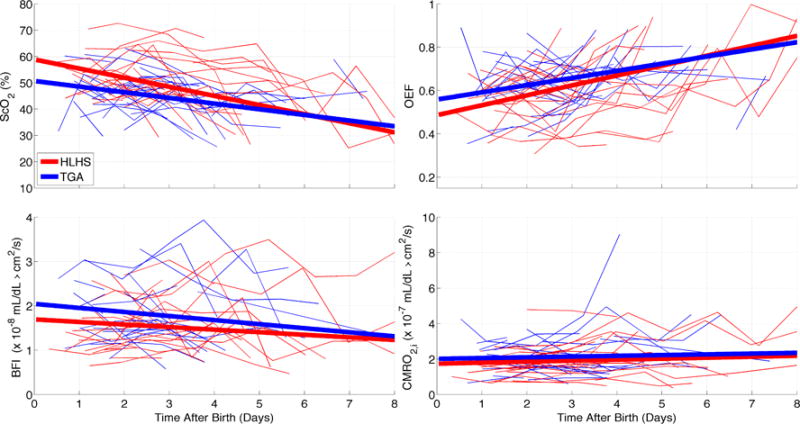
Figure 1.

Time profiles of ScO2 (a), OEF (b), BFI (c) and CMRO2,i (d). Each thin line represents measurements for a single subject with either hypoplastic left heart syndrome (red) or transposition of the great arteries (blue). Thick lines represent linear trends derived from a mixed effects model reported in Table 2.
