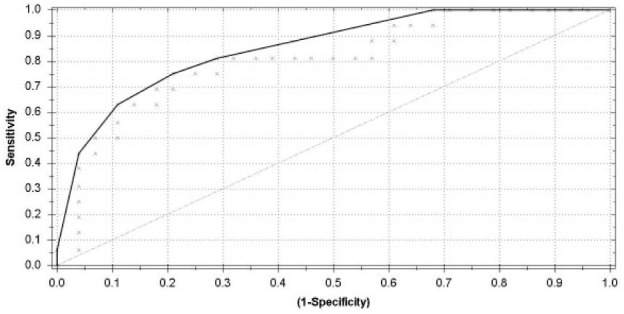
Figure 1.

The receiver operating characteristic curve illustrates the different sensitivities and specificities with altered thresholds of both the best fit of the data (dark gray line) and the data for double cross-validation (light gray line). The area under the curve is 0.83.
