
Figure 3.
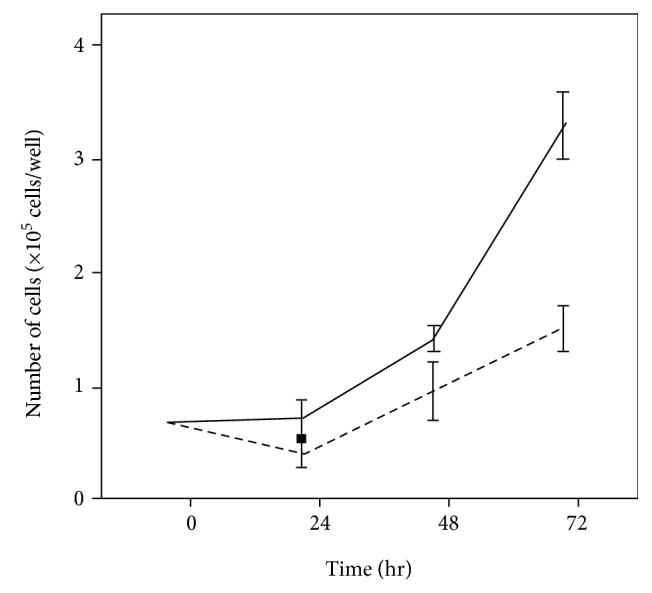
Effect of M-LPH-KO on the growth rate of HepG2 cells. The same number of M-LPH-WT and -KO cells was cultured in 6-well plates (n = 3 each), and the number of cells in each well was counted every 24 hours. The solid line and dashed line show the growth curves for M-LPH-WT and -KO cells, respectively. The bars represent the mean ± SD of the results from three independent experiments. The doubling time for M-LPH-KO cells (63.2 ± 9.84 h) were significantly longer than that for M-LPH-WT cells (31.8 ± 4.33 h) (p = 0.0072).