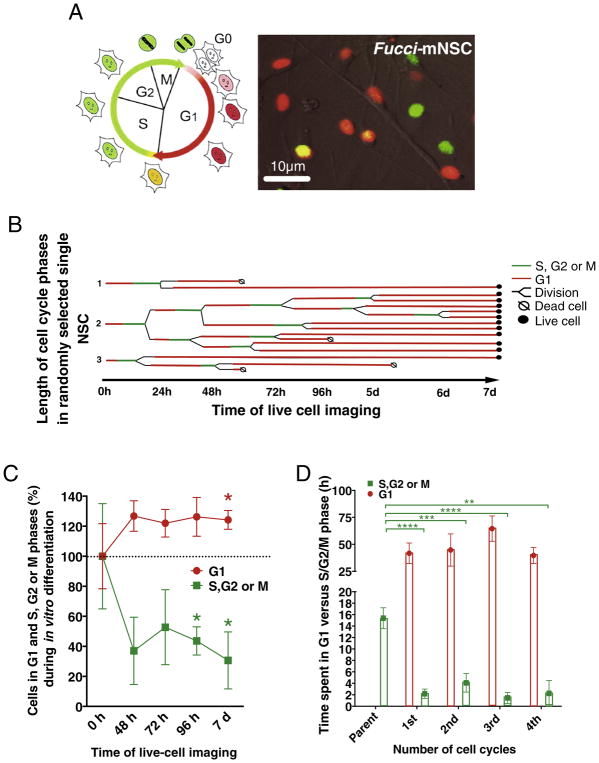
Fig. 3.
Fucci-reporter as a live-cell imaging tool for assessing mNSC cell cycle dynamics during in vitro differentiation. A) Fucci-expressing mNSC exhibit red nuclei when in G1 phase, during G1 to S transition cell nuclei turn yellow, and in S, G2 or M phases nuclei appear green. B) An example pedigree map to visualize length of G1 and S, G2 or M phase within the randomly selected Fucci-mNSC population over the course of 7 day fluorescence time-lapse in in vitro differentiation conditions. C) The proportion of Fucci-mNSC in G1 phase increased while S, G2 or M phase decreased between 72 h and 7 day timepoints relative to the 0 h timepoint, 1-sample t-test, *p ≤ .05, n = 3 independent biological experimental replicates, mean ± error bars SEM. In parallel, D) the progeny of Fucci-mNSC spent less time in S, G2 or M phase relative to parent cells. Student’s 2-tailed t-test *p ≤ .05, **p ≤ .01, ***p ≤ .001, ****p ≤ .0001, n = 3 independent biological experimental replicates, mean ± error bars SEM. (For interpretation of the references to color in this figure legend, the reader is referred to the web version of this article.)

