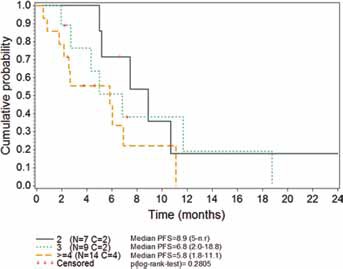
Fig. 1.

Kaplan-Meier plot of progression-free survival (PFS) according to the number of previous chemotherapy lines received. Data shown are medians (95% CI). C = censored; CI = confidence interval; N = number of patients; n.r. = not reached.

Kaplan-Meier plot of progression-free survival (PFS) according to the number of previous chemotherapy lines received. Data shown are medians (95% CI). C = censored; CI = confidence interval; N = number of patients; n.r. = not reached.