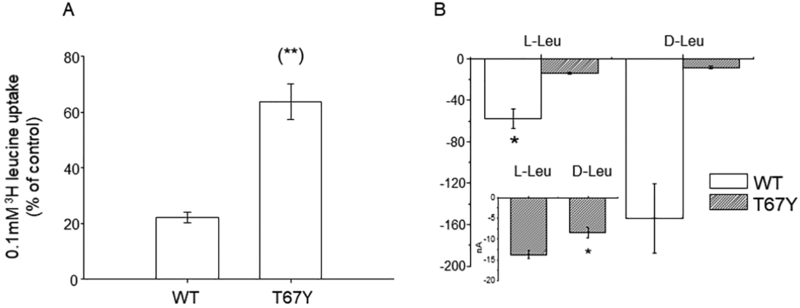
Fig. 8.
Effects of D-leucine application on L-leucine uptake. A) 0.1mM [3H]-L-leucine uptake induced by KAAT1 WT and the T67Y mutant was measured in the absence or in the presence of 4 mM unlabeled D-leucine. Data are means ± S.E. of three independent experiments with n ranging from 30 to 40 and are expressed as percentage of control uptake. (**) Statistically significant, P<0.001 when compared with WT. B) Transport current in the presence of D- and L- leucine reported as raw mean values ± SEM for WT (n = 25) and for T67Y (n = 7). The currents recorded in the presence of D-leucine are larger than the currents recorded in L-leucine for the wild type, while the opposite is true for the T67Y mutant. The inset is an enlargement of the data for T67Y (*0.05 level one-way ANOVA).

