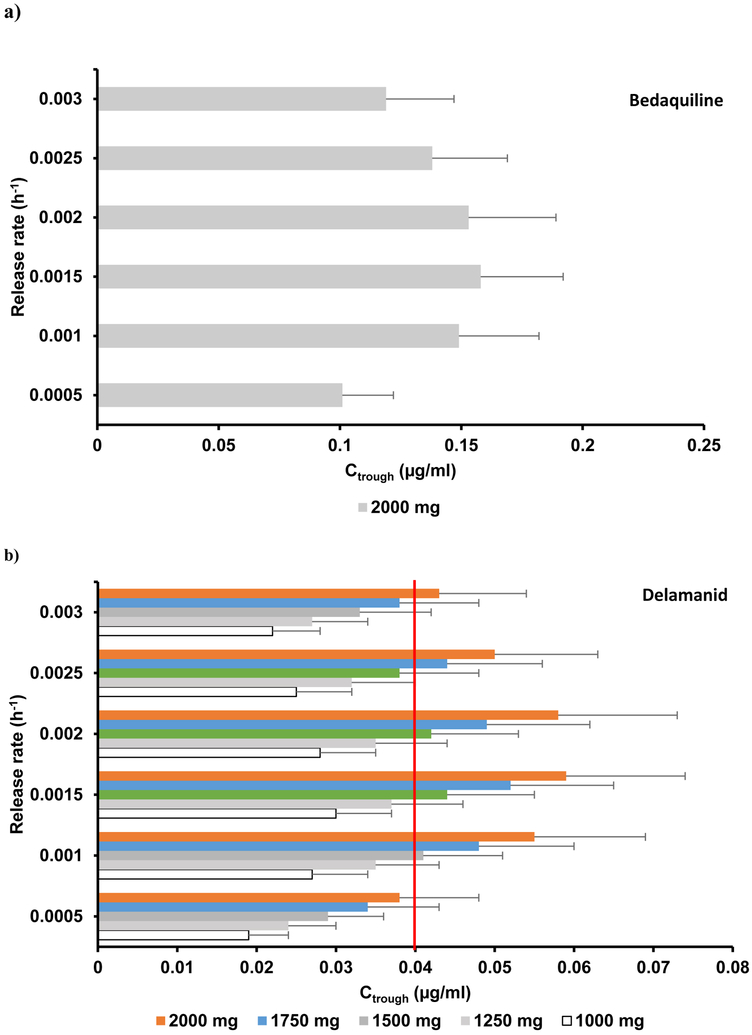
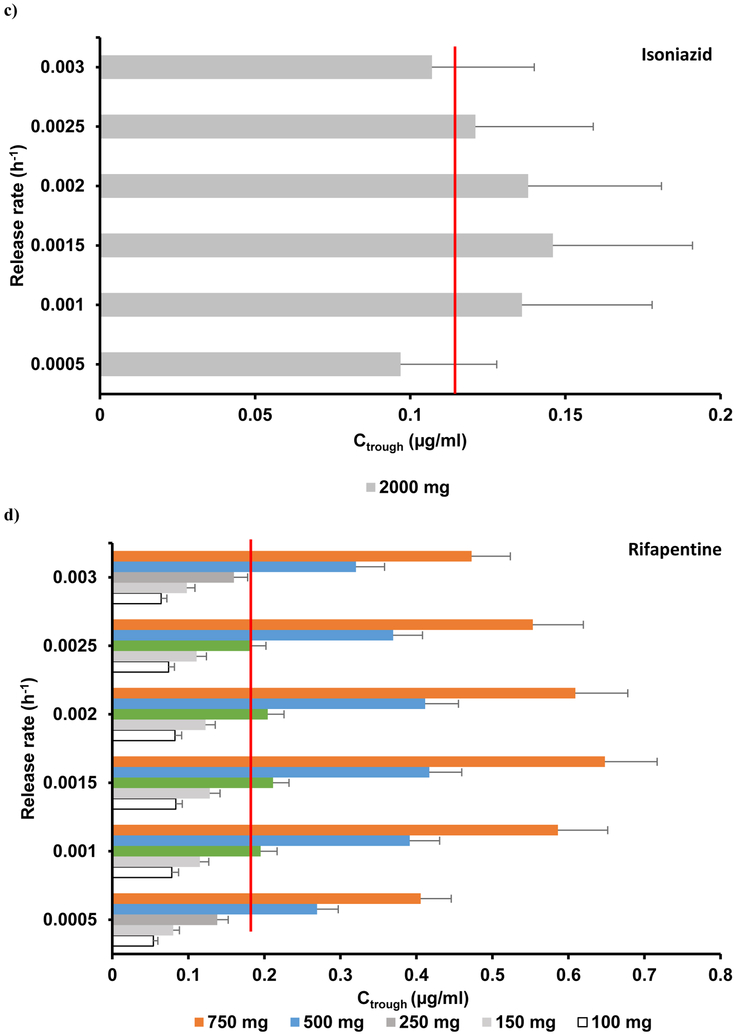
Figure 1.
Plasma trough concentrations of a) bedaquiline, b) delamanid, c) isoniazid and d) rifapentine after the administration of a single intramuscular injection on day 28 for various doses and release rates in adults. The red line represents the target trough concentration. The target concentration for bedaquiline is beyond the indicated scale, therefore not visible on the chart.


