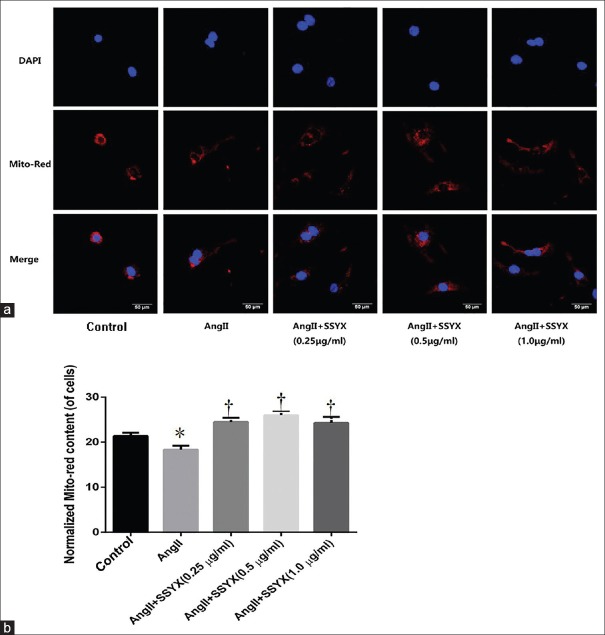
Figure 2.
Mitochondrial density in AngII-induced cardiomyocyte hypertrophy 12 h after SSYX treatment with different drug concentrations. (a) Representative fluorescence microscope image of cardiomyocytes costained with mitochondrial Mito-Red Tracker and myocardial cell nuclei DAPI staining at 12 h after treatment with 0.25, 0.5, and 1.0 μg/ml SSYX. Scale bars = 50 μm. Red staining denotes Mito-Red Tracker-stained mitochondria. Blue staining denotes DAPI-stained myocardial cell nuclei. (b) Normalized MitoTracker Red content. *P = 0.0002 versus control group; †P < 0.0001 versus AngII group. The data were expressed as the mean ± SD (n = 5, samples were collected from five different passages), the symbols “*, †” indicate that the value of Mito-Red Tracker content significantly differed from different groups. Ang: Angiotensin; SSYX: Shensong Yangxin Capsule; SD: Standard deviation.

