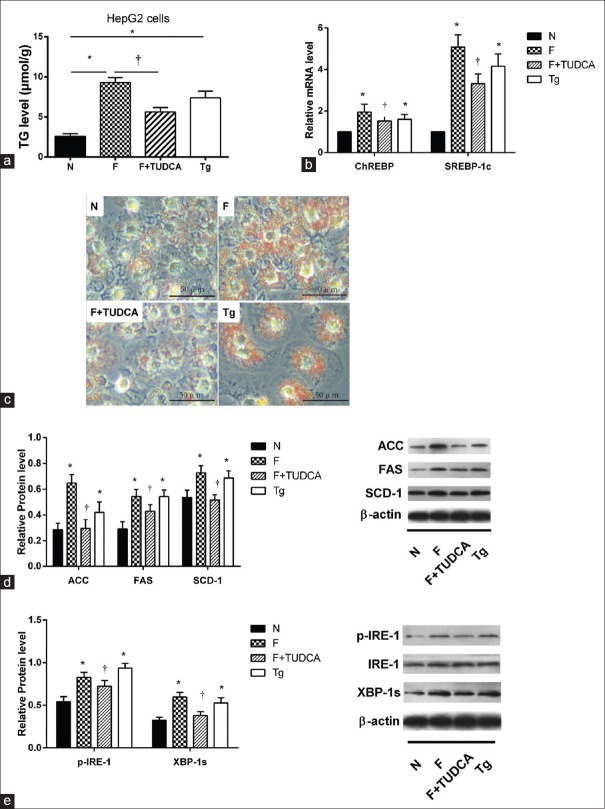
Figure 3.
The effect of selective ERS inhibitor-TUDCA and inducer-Tg on IRE/XBP-1 pathway and lipogenesis. (a) TG level was significantly lower in TUDCA group than F group but increased in Tg group compared to N group (n = 3), *P < 0.05 versus N group, †P < 0.05 versus F group. (b) SREBP-1c and ChREBP were significantly lower in F+ TUDCA group compared to F group and were significantly increased in Tg group compared to N group (n = 6), *P < 0.05 versus N group, †P < 0.05 versus F group. (c) Oil Red O straining was alleviated in F+ TUDCA group compared to F group and was sharpened in Tg group compared to N group. Scale bar = 50 μm. (d) Protein levels of three key enzymes (SCD-1, FAS, and ACC) were upregulated in F group compared to N group but were suppressed by TUDCA. They were significantly increased in Tg group compared to N group (n = 3), *P < 0.05 versus N group, †P < 0.05 versus F group. (e) Protein expression of p-IRE-1/IRE-1 and XBP-1s were significantly increased in HepG2 cells in F group compared to N group. They were lower in F+ TUDCA group compared to F group, but increased in Tg group (n = 3), *P < 0.05 versus N group, †P < 0.05 versus F group. Cells cultured with normal medium, 20 mmol/L fructose, 20 mmol/L fructose plus 0.2 mmol/L TUDCA, or 600 nmol/L thapsigargin were assigned into N, F, F+TUDCA, or Tg group respectively. Data are shown as mean ± standard deviation. TUDCA: Tauroursodeoxycholic acid; Tg: Thapsigargin; TG: Triglycerides; SREBP-1c: Sterol regulatory element-binding protein 1c; ChREBP: Carbohydrate response element-binding protein; SCD-1: Stearoyl-CoA desaturase-1; FAS: Fatty acid synthase; ACC: Acetyl-CoA carboxylase.

