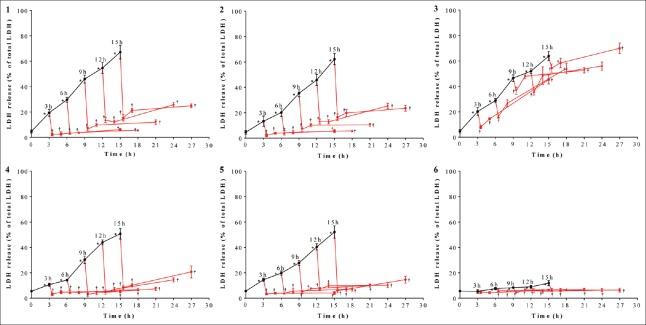
Figure 2.
SIR reduced LDH release after SI treatment. When durations of SI treatment were 3, 6, 9, 12, and 15 h, LDH release of SI, SIR-0.5 h, SI-2 h, and SIR-12 h groups in the models 1–6 using H9c2 cells. -: Indicates SI; -: Indicates SIR. Data are presented as mean ± SD (n = 6). *P < 0.05 compared to control group; †P < 0.05 compared to SI group with the same model. SI: Simulated ischemia; SIR: Simulated ischemia-reperfusion; LDH: Lactate dehydrogenase; SD: Standard deviation.

