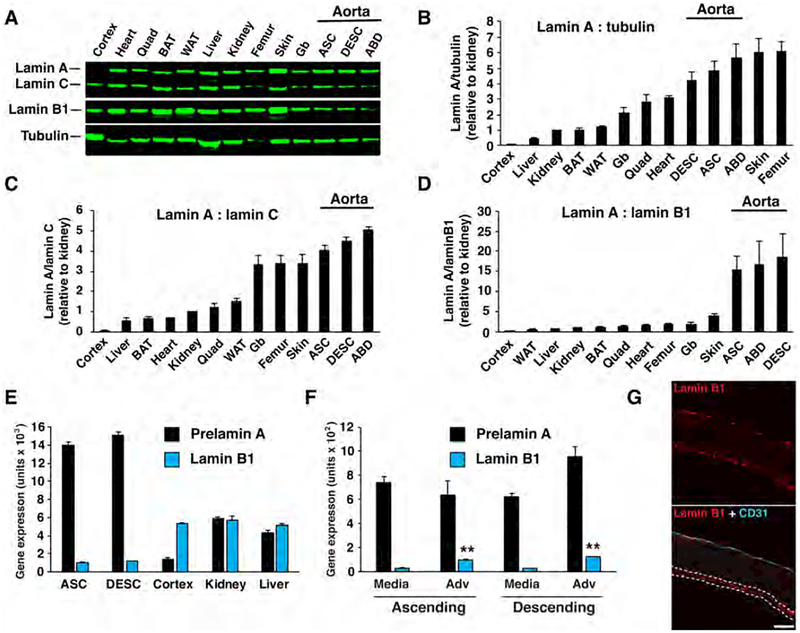
Figure 3. Lamin A is expressed at high levels in the aorta of wild-type mice.
Nuclear lamin expression in different tissues of wild-type mice was measured by western blotting, RT-PCR, and fluorescence microscopy. (a) Representative western blot comparing lamin A, lamin C, and lamin B1 levels in different tissues. Tubulin was measured as a loading control. Cortex, cerebral cortex; BAT, brown adipose tissue; WAT, white adipose tissue; Gb, gallbladder; ASC, ascending aorta; DESC, descending aorta; ABD, abdominal aorta. Graphs showing lamin A expression relative to tubulin (b), relative to lamin C (c), and relative to lamin B1 (d). For panels b–d, the tissues are arranged in ascending order from left to right, with the expression in kidney set at a value of one (mean ± SEM; n = 4 mice). (e) RT-PCR studies comparing the expression of prelamin A (black) and Lmnb1 (blue) in tissues (mean ± SEM; n = 4 mice). (f) RT-PCR studies comparing the expression of prelamin A (black) and Lmnb1 (blue) in the media and adventitia (Adv) layers of wild-type mice (mean ± SEM; n = 4 mice). Media vs. adventitia; **p < 0.001. (g) Confocal fluorescence microscopy images showing the expression of CD31 (cyan) and lamin B1 (red) in the ascending aorta of a wild-type mouse. In the merged image, the adventitia is outlined by dotted white lines (see Fig. S4g). Scale bar, 50 μm.

