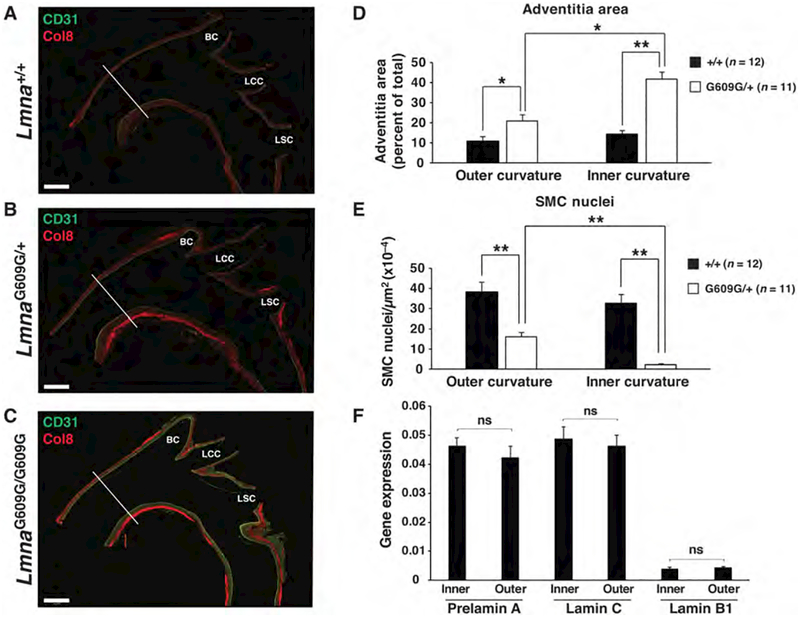
Figure 4. Vascular pathology is more severe along the inner curvature of the ascending aorta and branches of the aortic arch.
The number of SMC nuclei and adventitial area were quantified at the inner and outer curvature of the ascending thoracic aorta of LmnaG609G mice. The white lines in panels a–c identify the location where the measurements were made. (a–c) Composite fluorescence microscopy images of the ascending aorta stained with antibodies against CD31 (green) and collagen type VIII (red) in 12-month-old Lmna+/+ and LmnaG609G/+ mice, and a 4-month-old LmnaG609G/G609G mouse. BC, brachiocephalic; LCC, left common carotid; and LSC, left subclavian. Scale bar, 500 μm. (d) Bar graph showing adventitial area (as a percentage of total area) in wild-type (black bars) and LmnaG609G/+ (white bars) mice at the outer and inner curvature of the ascending aorta. (e) Bar graph showing the number of SMC nuclei (relative to media area) in wild-type (black bars) and LmnaG609G/+ (white bars) mice at the outer and inner curvature of the ascending aorta. Mean ± SEM for wild-type (n = 12) and LmnaG609G/+ (n = 11) mice; *p < 0.02 and **p < 0.001. (f) RT-PCR studies measuring prelamin A, lamin C, and Lmnb1 expression at the inner and outer curvature in wild-type mice (mean ± SEM; n = 4). Inner vs. outer; ns (nonsignificant), p > 0.20.

