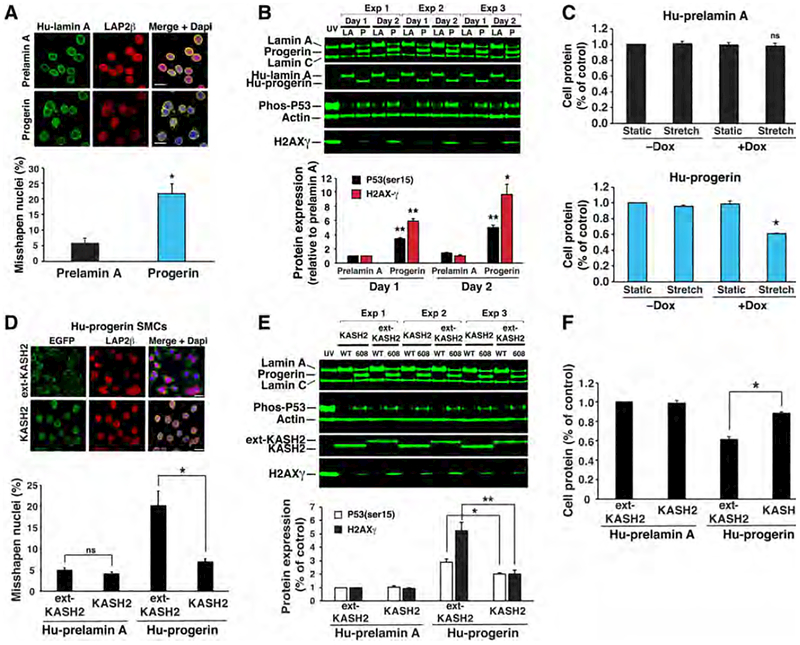
Figure 5. Disrupting the LINC complex in SMCs ameliorates phenotypes elicited by progerin.
(a) Microscopy images showing progerin increases misshapen nuclei in SMCs. Scale bar, 20 μm. Bar graph shows quantification of misshapen nuclei (mean ± SEM; n = 3 experiments). *p < 0.02. (b) Western blots showing that progerin (P) induces P53 phosphorylation and H2AX-γ expression compared to lamin A (LA). Cells exposed to UV light were included as a control. The bar graph shows the expression of P53 phosphorylation (black) and H2AX-γ (red) after 1- or 2-days (mean ± SEM; n = 3 experiments). Progerin vs. prelamin A; *p < 0.01, **p < 0.001. (c) Uniaxial strain induces cell death in progerin-expressing SMCs. Prelamin A- and progerin-expressing cells were exposed to stretching (6 mm, 0.5 Hz) or static conditions for 1 day. Cell protein was measured and expressed relative to static cells (mean ± SEM; n = 3 experiments). Stretch vs. static; *p < 0.001. (d) Microscopy images showing that KASH2 reduces misshapen nuclei in progerin-expressing cells as compared to ext-KASH2. Scale bar, 20 μm. Bar graph shows quantification of misshapen nuclei (mean ± SEM; n = 3 experiments). KASH2 vs. ext-KASH2; *p < 0.02. (e) Western blot showing that KASH2 reduces H2AX-γ levels and p53 phosphorylation in unstrained, progerin-expressing cells. The bar graph shows the average expression of P53 phosphorylation (white) and H2AX-g (black) after 1 day (mean ± SEM; n = 3 experiments). KASH2 vs. ext-KASH2; *p < 0.05, **p < 0.01. (f) KASH2 reduces cell death in stretched, progerin-expressing cells. The bar graph shows cell protein levels relative to stretched, prelamin A/ext-KASH2–expressing cells (mean ± SEM; n = 3 experiments). KASH2 vs. ext-KASH2; *p < 0.001.

