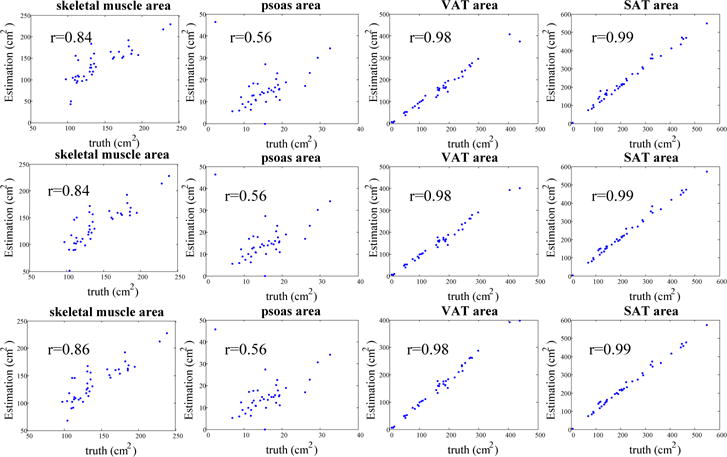
Fig. 5.

Scatter plots showing the correlation between estimated tissue area by the proposed method and the ground truth. The first row shows tissue area estimated on one slice at middle L3 position. The second and third row show the average tissue area estimated at three and five slices at the L3 position, respectively.
