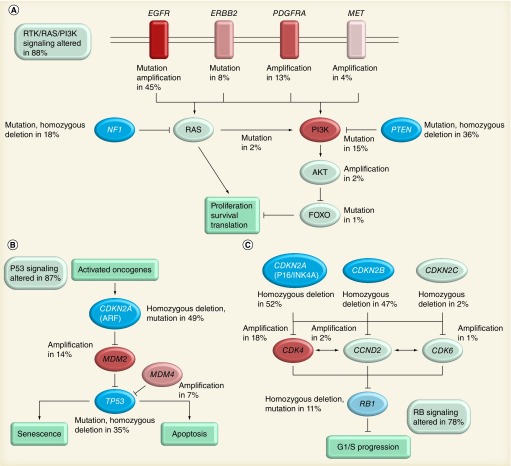
Figure 1. The Cancer Genome Atlas of glioblastoma multiforme.
Primary sequence alterations and significant copy number changes for components of the (A) RTK/RAS/PI3K, (B) P53 and (C) Rb signaling pathways are shown. Red indicates activating genetic alterations, with frequently altered genes showing deeper shades of red. Conversely, blue indicates inactivating alterations, with darker shades of blue corresponding to a higher percentage of alteration. For each altered component of a particular pathway, the nature of the alteration and the percentage of tumors affected are indicated. Boxes contain the final percentages of glioblastoma multiformes with alterations in at least one known component gene of the designated pathway.
Reprinted with permission from [27] © Macmillan Publishers Ltd (2008).

